Key Drivers of Mental Wellbeing in the Film and TV Industry
 The Film and TV Charity aims to provide a supportive community for everyone working behind the scenes in film, TV and cinema; a community that works together to make their industry work better. The Charity provides a range of resources including legal advice, a 24-hour helpline, financial advice and grants, toolkits and emotional support.
One of the Charity’s specific aims is to support and promote mental wellbeing. To help this, the Charity now conducts regular surveys to both provide a barometer of mental wellbeing among the people they support and to understand more about the issues facing those working in the FTV industry.
Select were delighted to be approached by the Charity who were looking to conduct a more in-depth analysis of the responses to their latest Looking Glass Survey to delve further than the headline findings. They asked us to create a statistical model in order to arrive at deeper insights.
The Challenge
The Looking Glass survey included a series of questions that comprise an established measure of mental wellbeing: the Short Warwick Edinburgh Mental Wellbeing Scale (SWEMWBS). The responses to these questions were scored (1 for strongly disagree to 5 for strongly agree) and summed to give a score to measure mental wellbeing. Researchers at the FTV Charity used the SWEMWBS scores to benchmark the mental wellbeing of their respondents against norms for the UK population.
The FTV Charity then wanted to dig deeper into the responses to their survey. They wanted to understand what the key drivers of mental wellbeing were. By understanding which aspects of working life impact, both positively and negatively, on mental wellbeing, the Charity can focus its activities and target initial support in areas that stand to gain the most benefit.
The Approach
Our plan was to use a statistical model to explore the key drivers of mental wellbeing. This model would show how the responses to the survey questions were associated with mental wellbeing (as measured by the SWEMWBS score).
However, the FTV’s survey, as with many other surveys, comprised many questions. The Charity’s own report said that the “Looking Glass ’21 had 59 questions, each with up to 12 sub-questions offering up to five possible answers [on a five-point Likert scale] to each question.” Researchers at the Charity recognised that there were “so many statistical relationships in this dataset that we would never be able to report more than a small fraction of them”. An additional feature of this and other surveys is that many of the survey questions were interconnected or correlated.
Therefore, prior to fitting a statistical model we used factor analysis to take advantage of the correlations and the richness of the data. Factor analysis is a technique that identifies which questions are correlated and combines the individual question responses to create more robust measures of the underlying trait that they collectively assess. (We explain factor analysis using a practical example in our blog.) We worked closely with researchers at the Charity to define the factors, as they had clear ideas, informed by the Charity’s own empirical experience and by other research, about which aspects of working in the FTV industry that were likely to be associated (positively and negatively) with mental wellbeing.
In the factor analysis we included questions from the survey that asked respondents’ opinions or attitudes to topics such as: financial security, views of their colleagues, the working culture around reporting behaviours, the nature of networking, work-life balance.
Having synthesised the survey responses into factors we then fitted a statistical model. We used the SWEMBS scores, the measure of mental wellbeing, as the outcome. Our model included all the factors that we had derived; the UCLA loneliness scale score (the other established scale that was embedded in the survey); selected individual survey questions that were not included in the factor analysis; and a number of background characteristics that could be associated with mental wellbeing, for example, age, whether the respondent was an employee or freelancer, the number of hours worked last week.
The figure below shows the results of our model, in descending order of each variable or component’s contribution to mental wellbeing.
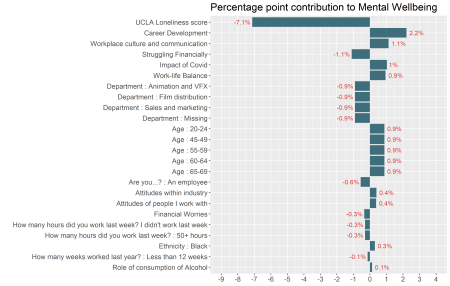
Variables associated with mental welling scores, an order of contribution.
The percentage points shown on the plot are the amount that the explanatory power of the model changes when the variable in question is removed from the model, and the direction of the bars show whether each variable is positively or negatively correlated with mental wellbeing.
The largest contribution was loneliness, which was negatively associated with mental wellbeing. The next 5 contributors were work-related factors. Those who responded positively about career development opportunities, workplace culture, the impact of changes to working practices due to Covid and their work-life balance tended to have more positive mental wellbeing. Respondents who reported that they were struggling financially tended to have lower mental wellbeing.
The Value
The combination of factor analysis and a statistical model meant that we were able to incorporate a large amount of information from the survey data in an economical way. Our analyses enabled the Charity to dig deeper into their data and “identify the key influences on mental health and the strength of their effects“. Knowing in which areas the charity and the wider industry should focus efforts has already generated conversations and actionable ideas about initiatives and provision of support aimed at improving mental wellbeing.
You can read more details of our work by downloading the FTV Charity’s report (in which they provide a link to our report).
“By developing a statistical model of the mental health of film and TV workers, Select enabled us to mine the information from our biennial survey to an extent that we had not been able to do before. The findings were insightful and generated much constructive discussion in our organisation plus a successful published report. We would definitely use them again. Indeed, we have already been back to them for further advice about the data we hold.”
David Steele – Research and Insight Manager