Getting More from your Survey Questions with Factor Analysis
Surveys can be a rich source of information, including not only factual questions, but asking about attitudes, behaviours, and activities. The results from a survey analysis can also provide more than just percentages, averages and crosstabulations.
Factor analysis is a statistical technique that combines questions that are related (correlated) into a smaller number of factors, to create more robust measures.
By combining questions or variables and using the resulting measures rather than analysing and reporting the questions individually, factor analysis is useful as a dimensionality-reduction technique (other dimension-reduction techniques include Principal Component Analysis [PCA], for example). And being based on correlations it can help to avoid some of the problems of collinearity that can arise in analyses. Furthermore, factors can often provide more meaningful results, by capturing overall, intrinsic characteristics and qualities, rather than individual, separate questions.
It is worth noting though that factor analysis can be used with many types of data, not just with survey responses. It can be used to analyse, for example, items bought in shops or supermarkets, time spent in different office areas (solo pods, meeting rooms, conference spaces, etc.), patient reported outcomes (PROs) (e.g., of pain or depression), and so on. Hence, factor analysis can not only help you to understand your students’, your customers’ or your employees’ attitudes and opinions, it can be used to help uncover their preferences and behaviours via transaction or office utilisation data, for example.
In this blog we show factor analysis in action.
 What Is a Factor?
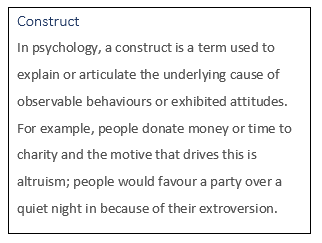
A factor, sometimes called a latent trait or construct, is an intrinsic characteristic or quality. Factors are multi-faceted and difficult to measure directly. Examples being qualities like empathy, IQ, self-confidence, or ethos.
The theory of factor analysis is that these deeper level factors or latent traits underpin your actions and attitudes and also influence your responses to questions about these topics.
Example Data
To illustrate factor analysis, we use some data from the Organisation for Economic Co-operation and Development’s (OECD) Programme for International Student Assessment (PISA) as an example. The PISA study runs every 3 years, across many countries, and assesses the numeracy, literacy and science knowledge and skills of 15-year-old students. The OECD make PISA data available for secondary analyses.
PISA also includes a teacher questionnaire. The 2018 questionnaire asked teachers to answer the following set of questions:
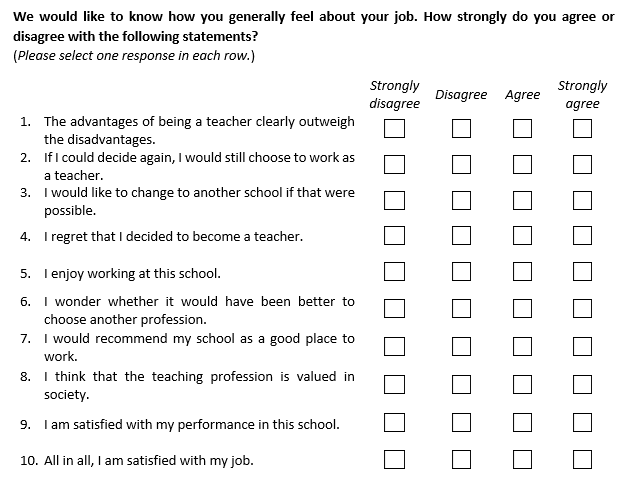
Our example is based on the responses of teachers in the UK.
Factor Analysis
The first step in factor analysis is to calculate the correlations between each of the questions. As the responses are on a Likert scale (from ‘strongly disagree‘ to ‘strongly agree‘) and are ordered categorical (ordinal) data rather than on a continuous scale, we calculate polychoric correlations, which are appropriate for these sorts of data (unlike, for example, Pearson product-moment correlations).
In the next step, the appropriate number of factors to be extracted is determined (ensuring, for example, that a sufficient proportion of the variation in the data is explained), and factor solutions are calculated based on the correlations (e.g., perhaps using the fa() function in the psych package in the statistical software R). Factor analysis groups together questions that are highly correlated to derive a smaller set of factors that retain a high proportion of the information in the original questions. We won’t go into the detail of how this is done here (as it’s not the focus of this post), but in our example we find that 2 factors are potentially a good solution.
A key aim of factor analysis is to obtain factors that are interpretable. To interpret the factors, we look at the “factor loadings” from the factor analysis output. Each factor has a set of factor loadings corresponding to the input questions. These are the correlations between each input question and the factor, the underlying latent construct.
We identify the questions that are strongly correlated with each of the underlying factors. Strong correlations are indicated by values close to +1 or to -1 (positively and negatively correlated, respectively), weaker correlations are values closer to zero.
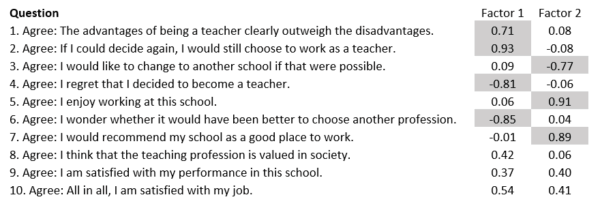
In the example below, we see that the 1st, 2nd, 4th and 6th statements are strongly correlated with factor 1, and the 3rd, 5th and 7th statements are strongly correlated with factor 2. (These are indicated by the shaded cells.) Though, we note that statements 8, 9 and 10 also correlate with the factors, but to a lesser extent.
Interpreting the Factors
Factor 1 – Satisfaction with Teaching
The strong correlations between the statements with shaded cells and factor 1 indicate that teachers who agreed that “The advantages of being a teacher clearly outweigh the disadvantages” also tended to agree with the statement “If I could decide again, I would still choose to work as a teacher“. In addition, teachers who agreed with these first 2 statements also tended to disagree (indicated by the negative correlation) with the statements “I regret that I decided to become a teacher” and “I wonder whether it would have been better to choose another profession.”
The converse is also true; teachers who disagreed with the first two statements tended to agree to the latter two shaded statements.
Collectively these four statements provide a measure of teachers’ satisfaction with being a teacher: their satisfaction with their profession.
Factor 2 – Satisfaction with Their School
In factor 2, the strong correlations between the 3rd, 5th and 7th statements (with shaded cells) and the factor indicate that teachers who agreed that “I enjoy working at this school” also tended to agree with the statement “I would recommend my school as a good place to work“, and additionally tended to disagree (indicated by the negative correlation) with the statement “I would like to change to another school if that were possible“. Again, the converse is also true; teachers who agreed with the first statement tended to disagree with the latter two statements.
Collectively these three statements provide a measure of teachers’ satisfaction with their particular school.
All in All, I Am Satisfied with My Job
Ideally the correlations between statements and factors should show associations between each statement and only one of the factors (or neither of the factors). In the factor loading matrix above, the final statement (“All in All, I Am Satisfied with My Job“) is positively correlated with both Factor 1: teachers’ satisfaction with their profession, and Factor 2: teachers’ satisfaction with their school, though the correlations are weaker than for the shaded statements (and are described as moderate rather than strong). It is quite sensible in terms of interpretation that teachers’ overall job satisfaction is (positively) related to both their satisfaction with the profession and with their school. However, since the correlations associated with this statement are not strong, the factors may be improved by excluding this statement, and the other statements with small correlations, from the analysis, as they may be adding more noise than information.
What Next?/Using Factors
Having identified and interpreted the factors, we can use the data and the factor solution to calculate factor scores: in this case use the teachers’ responses to calculate the ‘satisfaction with the profession’ and ‘satisfaction with their school’ measures for each teacher. (A weighted combination of the factor loadings multiplied by the corresponding question responses gives the factor score, measuring the relative magnitude of each factor (i.e., trait), for each teacher.)
Teachers’ scores, whether they are high or low, or nearer the average, will reflect (because they are calculated from) their levels of agreement and disagreement and the strength of their opinions. And so, we have taken responses to (in this case) 10 categorical variables and created two scale measures (continuous variables), which provide more robust measures of teachers’ satisfaction than the survey questions individually.
While factor analysis is a technique in its own right, it is not usually the analysis outcome itself. The derived factors can be really useful when used in subsequent analyses. They can be used to compare or describe different groups of teachers, for example to answer hypotheses such as are older teachers more satisfied with their profession than younger teachers? They can be used in statistical models, for example to explore whether and how students’ outcomes vary according to their teachers’ levels of satisfaction or what are the drivers of teachers’ satisfaction? They can be used with cluster analysis to identify groups of teachers according to their characteristics. Similarly, in another context, with a customer or brand survey, for example, we could investigate whether customer satisfaction might be associated with a particular customer demographic, or cluster customers into different groups based on their attitudes, opinions, preferences, and shopping behaviours, to better understand your customer base and brand positioning, and target products and/or advertisements accordingly.