Age Standardisation or Norming of Educational Tests
![]() Select recently had the opportunity to work with Taylor and Francis, who publish books and academic journals. They were looking to update and publish a 5th edition of the Renfrew Expressive Vocabulary Test, and approached us to provide statistical support.
Select recently had the opportunity to work with Taylor and Francis, who publish books and academic journals. They were looking to update and publish a 5th edition of the Renfrew Expressive Vocabulary Test, and approached us to provide statistical support.
The Expressive Vocabulary Test contains a set of flashcards, each of which has an illustration of a word: either a noun, adjective or a verb. Children are shown the flashcards one at a time and are asked to name as many words as they can. The test is designed to assess the speech and language of children aged 3 to 11.
The Challenge
Raw scores on a test (the total number of questions answered correctly) often increase with age; older children tend to score more highly than younger children. Therefore, raw scores are not very informative. The Renfrew Expressive Vocabulary Test is perhaps fairly unusual among tests, in that it spans a wide age range of 9 years. The age range is also over a time when children’s vocabulary will be expanding considerably. So, the raw scores of older children will be considerably higher than those of younger children. How do we make a fair comparison?
The Solution
To take account of the raw scores across children of different ages, we used a statistical model to translate raw scores onto a scale that is independent of age. Taking account of the effect of age in this way is known as age-adjusting, age-standardising or age-norming.
The children are grouped according to their age (we used 6-month age bands) and within each age-group percentiles of raw score are calculated (for example, the 5th, 10th, 20th etc percentile). A statistical model is then fitted to the set of percentiles with age as a covariate. There are a range of different models that can be applied, and the aim is to obtain a model that is a good fit to the observed data (the test scores) while avoiding the possibility of the model over-fitting the data.
The plot below shows the results of our model. The dots are the observed data (the percentiles of raw scores of the children in each age group) and the lines show our fitted model.
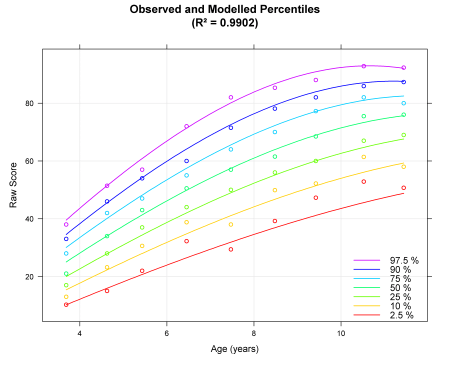
Figure 1: Plot of percentiles by age.
Produced using cNORM. Lenhard, A., Lenhard, W., Gary, S. (2018). Continuous Norming (cNORM). The Comprehensive R Network, Package cNORM, available: https://CRAN.R-project.org/package=cNORM
The plot clearly shows that not only do raw scores increase with age, but also that the scores of older children vary more than the scores of younger children (the percentiles are further apart for older age-groups compared to younger ages).
There may also be some evidence of a small ceiling effect (the maximum score was 100). The focus of the test, however, is to identify children who may need additional support i.e., those at the lower end of the score range for their age.
Using the results of our model, we provided a look-up table for raw scores and age. After testing a child this will be used by practitioners to convert their raw score to an age-appropriate percentile rank, telling them how the child’s score compares to other children of the same age.
The Value
It is good practice to update or recalibrate educational and psychological assessments that have been in use for a long time to ensure they remain relevant to the skills being tested and the current characteristics of the population. As well as new words, the updated edition of this test includes the addition of verbs and adjectives, updated illustrations and extends the age range.
The model that we fitted across this wider age range and our look-up table allows practitioners, usually Speech and Language Therapists, to assess children’s vocabulary relative to their peers, and to identify children who would benefit from additional support in the development of their language skills.
“Select provided us with invaluable guidance throughout our project, from key considerations as the journey started and expert advice on a complex re-standardisation process, to the creation of an accessible statistical model to assess children’s vocabulary. In addition to this, the statistician we worked with, Jo, was friendly, collaborative, and speedy to reply to (and problem solve) our many and varied queries and we have no doubt we would work with Select again – and hope to in the future!”
Clare Ashworth – Senior Editor, Routledge Education (Informa Group)