Clustering Types of Advice for Citizens Advice Scotland
The Challenge
![]() Citizens Advice Scotland (CAS) bureaux provide advice to clients from all walks of life which covers a wide range of information and advice needs: as their website says “whoever you are and whatever your problem“. CAS knew, from their experience and qualitative research, that the advice sought by their clients was often complex and inter-connected. After seeking advice initially on one topic, conversations with advisors often revealed other issues which led to subsequent advice being given on other topics. For example, clients seeking advice about pensions often also received advice about disability/carers and about tax, and many clients seeking relationship advice also received legal advice and advice about housing. CAS wanted to better understand the inter-connectedness of the advice needs of their clients and asked us to analyse the co-incidences of advice received by their clients.
Citizens Advice Scotland (CAS) bureaux provide advice to clients from all walks of life which covers a wide range of information and advice needs: as their website says “whoever you are and whatever your problem“. CAS knew, from their experience and qualitative research, that the advice sought by their clients was often complex and inter-connected. After seeking advice initially on one topic, conversations with advisors often revealed other issues which led to subsequent advice being given on other topics. For example, clients seeking advice about pensions often also received advice about disability/carers and about tax, and many clients seeking relationship advice also received legal advice and advice about housing. CAS wanted to better understand the inter-connectedness of the advice needs of their clients and asked us to analyse the co-incidences of advice received by their clients.
The Approach
CAS supplied data from their database which contained details about the type of advice sought by their clients as well as information such as the method of contact and the dates on which advice was given. In dialogue with CAS we used this data to calculate variables that captured the key characteristics of the advice received by clients, such as:
- the number of sessions of advice given (clients can return multiple times for follow-up advice),
- the duration of the advice (how long the client case took from the initial to the final session),
- the number of different types of advice given, and
- the number of units of advice given for each of the advice types.
These variables allowed us to measure the simplicity or complexity of the initial and subsequent advice received and how different advice types interacted with one another.
We then used cluster analysis to group clients based on the characteristics and co-incidences of the types of advice they received. Cluster analysis groups observations (in this case, clients) that are similar together into clusters and separates observations that are dissimilar into different clusters based on the key characteristics defined above. We identified a total of 15 clusters in the data.
To visualise the clusters, we produced the bubble plot in Figure 1, below. The plot is divided into two parts.
The circles in the top rectangle illustrate the characteristics of the advice sessions (for example the total number of occasions or sessions of advice and the duration from the first to the last session of advice). Here the size of the circles represents the average (mean) value for a client case in each cluster. For example, we can see from the plot that the mean number of total sessions is largest for cluster 15, followed by clusters 9 and 3 (with mean values 25, 8 and 7 sessions respectively).
The circles in the bottom rectangle of the plot illustrate the types of advice received. The size of the circles represents the proportion of units of different types of advice given to client cases in each cluster. For example, Cluster 13 predominantly contains cases involving advice about Consumer and Legal Proceedings. The sizes of the clusters is shown at the bottom (the percentage of clients in each).
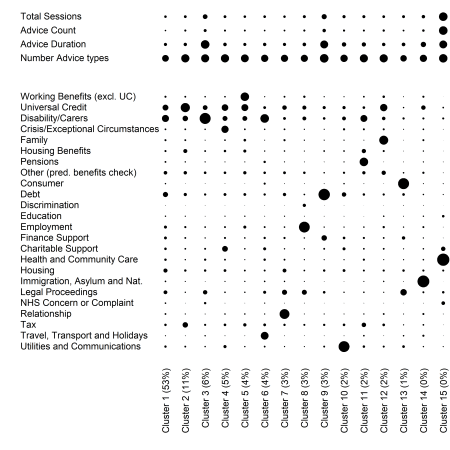
Figure 1: Bubble-plot of cluster characteristics
While some clusters are predominantly about one type of advice, e.g. Utilities and Communications (Cluster 10) and Immigration, Asylum and Nationality (Cluster 14), other clusters are about multiple advice types. For example, Cluster 4 shows that advice about Universal Credit, Disability or Carers, Crisis or Exceptional Circumstances and Charitable Support often coincide. The cases in Cluster 3 (Disability and Carers), Cluster 9 (Debt) and Cluster 15 (Health and Community Care) were long and complex involving relatively high number of sessions over a long duration.
After the cluster analysis we were able to compare the demographics of clients in each of the clusters and also to explore the sequential nature of advice given to clients in each cluster, to explore the advice journey. We produced Sankey plots, also known as river plots, like the one below to illustrate the complexity of advice journeys. These plots illustrate flows through a system, through a client journey, by representing the volume in each ‘avenue’ by the width of the flow in the plot. Each client’s advice journey is unique, and so we couldn’t show all journeys. For pragmatic reasons we limited the information that we presented to the top 20 most common journeys in each cluster over the first 3 sessions.
Figure 2 shows a river plot for Cluster 14 which comprises cases involving advice about Immigration, Asylum and Nationality. For the 20 most common advice journeys in Cluster 14 (33% of the total journeys in the cluster) the plot shows the proportion of client cases receiving different types of advice in their first three sessions (labelled S1, S2 and S3). A large proportion of advice given in each session is solely about Immigration, but other common advice co-incidences are Universal Credit, Travel/Transport, and Working Benefits, though there are many more co-incidences of advice types.
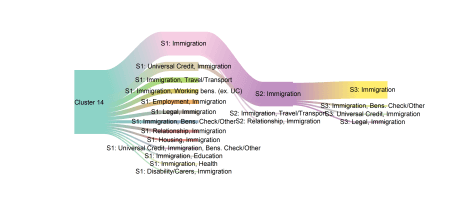
Figure 2: River plot for Cluster 14
Overall, these river plots illustrated the complexity of the co-incidences of advice given to clients. Even within the clusters that have the simplest co-incidence structure (e.g., predominantly one advice type in the clustering) and restricting to viewing the 20 most common advice journeys, the sequence and the combination of advice given is complex. This reflects the natures of peoples’ lives; many problems are inter-connected and multi-faceted and the initial type of advice about which a client seeks advice often leads to advice on other and sometimes more substantive issues.
The Value
The data we analysed was hugely complex and had never been explored in detail before. We were able to synthesise the information in the data and provide insights for CAS. By understanding the co-incidences of types of advice sought by clients, CAS is able to identify more quickly additional needs that clients may have when they initially seek help. While some organisations provide advice in one area, for example debt or relationships, it is important that organisations such as CAS, who provide a broad spectrum of advice, are able to demonstrate to potential funders that the service they provide addresses multifaceted issues and problems.
“Select Statistics did a remarkable job for us. Having given them a large and disjointed set of data, not only did they successfully wrangle this into a useable shape but also conducted analysis that helped us gain an understanding of our data (and, by association, our clients) that we’ve never had before. The work carried out by Lynsey and Jo has been genuinely transformative for us in a number of ways, and I very much hope we get the chance to work with them again.”
Linda Hutton – Senior Research Officer