EU Freedom of Movement: What are the numbers?
With the EU Referendum fast approaching, we’re being inundated with facts, figures and opinions related to whether the UK should remain or leave the EU. Much of this information has been collated by individuals and organisations that have a vested interest in one or other side of the campaign and so it can be difficult to identify whether the information is biased in some way. We’ve taken this opportunity to look at the data collected about the EU ourselves in order to better understand what these data tell us about the EU as a whole and how being a member state affects the UK. In the following weeks we plan to release a series of impartial blogs on different topics such as migration, international trade and the EU budget to help you make a more informed decision as to how you vote on June 23rd.
Freedom of Movement
A fundamental principle of being a member of the EU is the free movement of workers between member states. This is one of the key areas of debate as it means that there is no cap on the number of EU migrants entering the UK (and similarly UK migrants entering other member states). Therefore, in this first blog, we’ve chosen to focus on migration. We’ll look at migration between the UK and the rest of the EU member states, but consider this within the wider context of migration to and from the rest of the World.
Deciding who counts as a migrant varies across countries, organisations and data sets. Typically, migrants are defined as foreign nationals (i.e. someone who is not a citizen of the country they are currently living in) though they may also be required to have stayed in a country for a certain length of time before being classified as a migrant to distinguish them from holiday-makers for example. For an interesting discussion on this together with the implications of having no standard definition, we’d recommend reading this article by The Migration Observatory.
To investigate migration numbers, we’ve chosen to use the mid-2015 population estimates of migrant stock from the United Nations Population Division. In this data set, a migrant is defined to be “a person who is living in a country other than his or her country of birth”. The estimates are based on data collected on foreign-born nationals from each individual country.
Migration Within the EU
In the first figure below, we illustrate how many migrants have left each member state to live in the UK and, conversely, how many UK migrants have gone to live in each member state. For example, we find that there are approximately 322,000 German migrants living in the UK compared to 104,000 UK migrants living in Germany. This is a consistent pattern (more EU migrants in the UK compared to UK migrants in the EU) across all the member states except two: Spain and France. Overall, we find that there are approximately 2.4 times more EU citizens in the UK then than there are UK citizens elsewhere in the EU (or in absolute terms there are 2.8 million EU citizens in the UK compared to 1.2 million UK citizens in the EU).
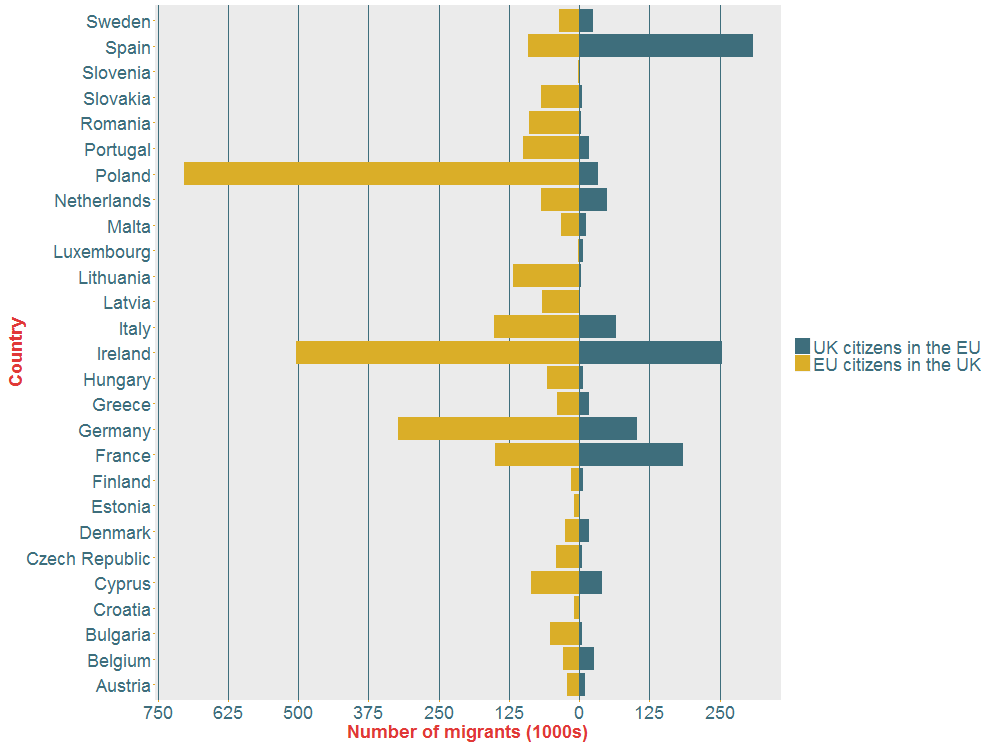
Figure 1: Bar chart illustrating the estimated number of migrants (in 1000s) entering the UK from an EU country and the number of UK migrants entering each EU country.
The country with the largest number of estimated citizens in the UK is Poland whereas Spain contains the largest number of UK citizens. Whilst the vast majority of Polish citizens may be coming to the UK to work (we’ll look into the EU workforce within the UK in a coming blog), we know from the Department of Work and Pensions that over 106,000 citizens within Spain currently draw a state pension highlighting that many UK residents there (at least one third) have retired there.
The table below provides the estimated numbers of migrants for the top 5 destinations for UK citizens in the EU and country of origin for EU citizens in the UK. With the exception of Poland and Spain, the countries are in fact the same.
| EU Citizens in the UK | UK Citizens in the EU | ||
| Poland | 703,050 | Spain | 308,821 |
| Ireland | 503,288 | Ireland | 254,761 |
| Germany | 322,220 | France | 185,344 |
| Italy | 151,790 | Germany | 103,352 |
| France | 149,872 | Italy | 64,986 |
Migration to and from the Rest of the World
The above figures on their own are interesting, but it’s also useful to understand how they relate to migration in and out of the UK as a whole. In Figure 2 we’ve plotted the estimated total number of UK migrants in EU and non-EU countries (the green bars) together with the number of migrants in the UK from EU and non-EU countries (the mustard bars).
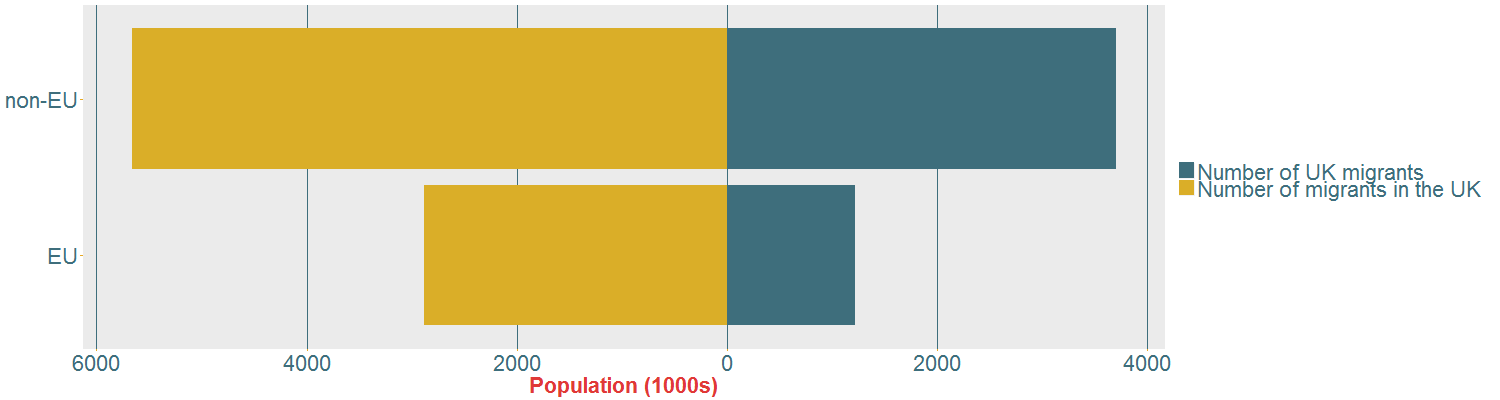
Figure 2: Bar chart illustrating the estimated number of UK migrants in EU and non-EU countries and the estimated number of migrants in the UK from EU and non-EU countries.
Looking at the total number of estimated migrants in the UK, we find that approximately 2.8 million are from the EU and 5.6 million are from outside of the EU. This means that there are almost twice the number of non-EU migrants compared to EU migrants in the UK. Clearly, even if the UK voted to leave the EU, there would still be a large number (the majority) of migrants living in the UK (particularly if a number of the EU skilled workers were still able to obtain visas to remain within the UK).
To investigate the non-EU migrants further, we have extracted the top 5 non-EU countries from which migrants within the UK come. These numbers illustrate that, individually, India contributes the highest number of non-EU migrants, followed by Pakistan and Bangladesh. Comparing the numbers with above, we can also see that the numbers from individual non-EU countries are not dissimilar to those coming from EU countries. For example, a similar number of migrants come from India as Poland and from Pakistan as Ireland.
| India | 776,603 |
| Pakistan | 540,495 |
| Bangladesh | 230,143 |
| South Africa | 218,732 |
| Nigeria | 216,268 |
We can also compare the breakdown of UK migrants by their destination (EU versus non-EU). These are the green bars in Figure 2. There are 1.2 million UK migrants living in EU countries and 3.7 living in non-EU countries; more than three times as many UK migrants live outside of the EU than in it.
The UN data also provides the estimated size of the migrant population for every 5 years from 1990 to 2015. In Figure 3, we have plotted these estimates over time for migrants within the UK from both the EU and outside of the EU as well as UK migrants who are living in the EU and outside of the EU. From this plot we can see that the rate of migration has increased in both directions (both migrants entering the UK and UK migrants abroad), but the biggest change over the past few years has been the immigration of non-EU nationals to the UK (an increase of 146% compared to 114% for EU nationals).
When we first produced the plot below and published this blog, we noticed that there was a discrepancy in the data set; specifically that the estimated number of UK migrants in Australia was 0 in both 1990 and 1995 (compared to over 1.1 million in 2000). This resulted in an apparent jump of around 1 million in the estimated number of UK migrants outside of the EU between 1995 and 2000. We emailed the UN migration team about this and were extremely impressed with how quickly they dealt with our enquiry. In fact, an updated data set correcting this issue is now already online. In the updated plot below, we can see that the estimated number of UK migrants outside of the EU have only increased in the last ten years and before 2000, it is estimated that there were more UK migrants outside of the EU than non-EU migrants in the UK.
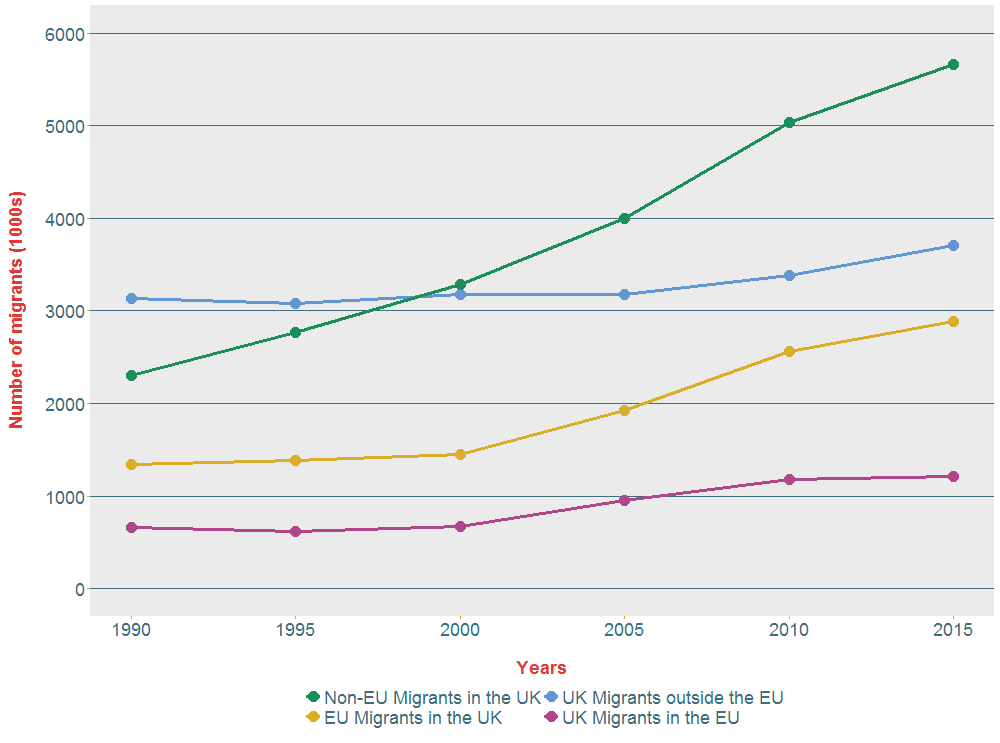
The estimated number of migrants in mid-2015 entering the UK (both EU and non-EU) and UK migrants leaving (to both EU and non-EU countries).
Analysing the UN estimates of migration, we have found that there are 2.4 times more EU migrants in the UK compared to UK migrants living in the rest of the EU. However, when we are looking at migration within the UK as a whole, we find that EU citizens only make up around a third of all migrants. This highlights that leaving the UK wouldn’t necessarily reduce migration to the UK substantially. At an individual country level, there is no one country from which the vast majority of migrants to the UK come (the two top countries are Poland and India), but the total number of migrants is made up of a large number of nationalities. Migration has been increasing over time and we find that migration from non-EU countries to the UK has increased at a larger rate than EU countries (146% since 1995 compared to 114%). In an upcoming blog, we’ll explore migrants in the UK in more detail to understand how they are represented across the work force.