How Much Does the EU Cost the UK?
In the run up to the EU referendum, we’re continuing our blog series on the EU and how being a member state affects the UK. In this blog we’ve focussed on the data from the 2014 budget to understand how much the EU costs the UK and what we get back. (Note that the 2014 budget is the most recent data available via the European Commission, since the final budget for the 2015 financial year, which finished in April, is yet to be released.)
EU Revenue
The EU’s revenue is made up of payments from each of the EU member states (92.4% of all income), together with the surplus from previous years (0.7%) and other revenue such as interest from bank accounts or contributions from non-member countries to EU programmes etc. (6.9%).
The member payments are broken down into three distinct types:
- Gross National Income (GNI)-based revenue, which is a 0.7% levy of each member state’s GNI;
- VAT-based revenue, which comprises a percentage (usually 0.3%) of each member state’s standardised value added tax rate; and
- Traditional owned resources (TOR), such as customs duties on imports from outside the EU and sugar levies.
There are also a number of adjustments made to the payments from each member state. The most topical of these in the context of the referendum is the UK correction that was introduced in 1985 to correct for the “imbalance between the United Kingdom’s share in payments to the Community budget and its share in the Community expenditure”. This is essentially a rebate on the UK’s contribution to the EU’s budget to account for the fact that a large proportion of the budget is spent on agricultural policy, which the UK benefits from much less than other member states (although this imbalance has reduced over the years as the proportion spent on agriculture lessens).
Taking account of these corrections, the total breakdown of the EU’s revenue is provided in Figure 1 from which it is clear that by far the largest contribution is from GNI resource payments (almost 70%).
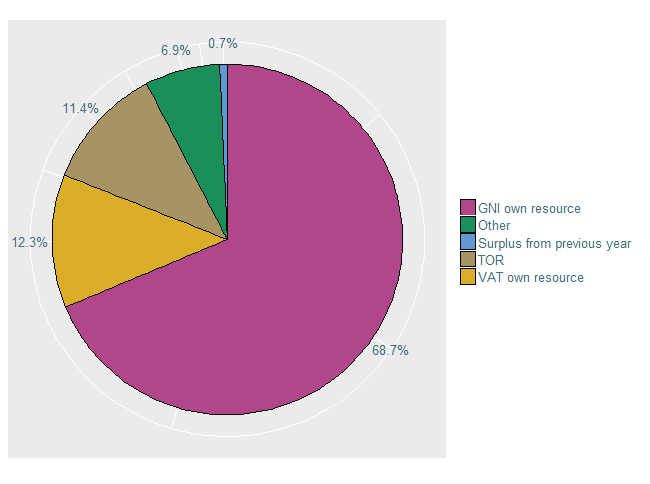
Figure 1: The breakdown of the EU’s 2014 revenue.
The GNI payment is consistently the largest payment across all member states, but as Figure 2 (below) illustrates, there are variations in the sizes of the different payment types. For example, the contributions from countries such as Belgium and Netherlands are made up of proportionally larger TOR payments (approximately 30% and 24% respectively) than many of the other member states. It is possible that this is because both of these countries contain busy ports and are therefore subject to more custom duties. The UK’s contribution to the 2014 EU budget was made up of 19.4% TOR, 20.8% VAT-based and 59.8% GNI payments. Proportionally, the UK’s VAT-based payment is higher than the remaining member states and the GNI payment lower.
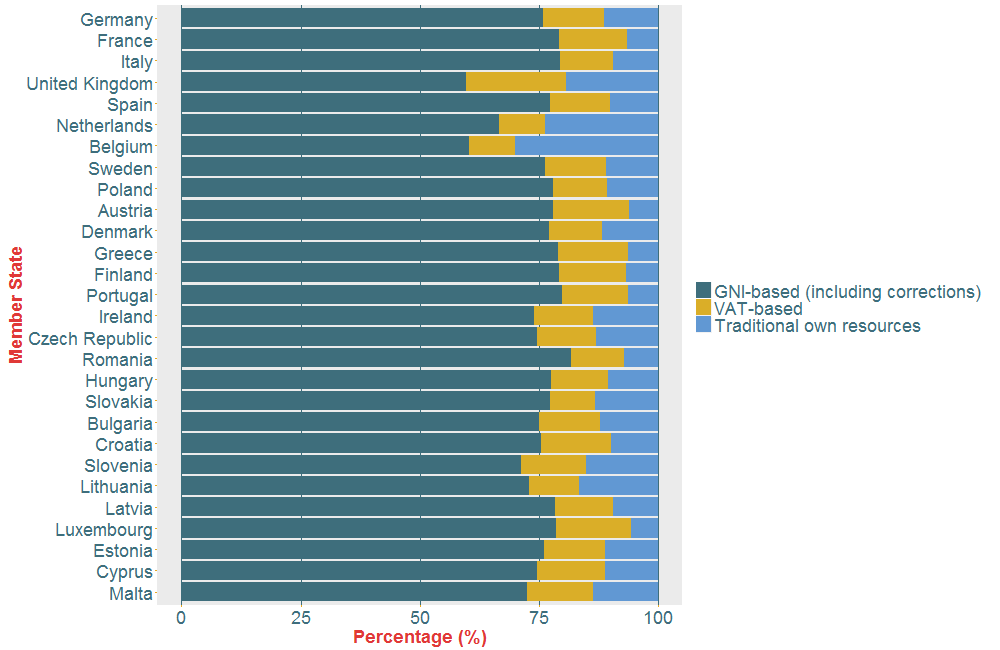
Figure 2: The breakdown of each member state’s contribution to the EU budget in terms of their GNI-based, VAT-based and TOR payments. The member states are ordered in terms of the absolute size of their contributions to the budget (with Germany the largest and Malta the smallest).
In total, the EU’s revenue for 2014 was €144 billion of which approximately €14 billion (or 9.7%) was contributed by the UK. This made the UK the 4th largest contributing member state implying that the UK contributes considerably more than many other member states. However, if we look at this number relative to the size of the UK economy or its population, we’ll see that this isn’t necessarily the case. (Note that to calculate the per capita figures we have used 2014 population data from Eurostat.)
Comparing the size of the UK’s payment to its Gross National Income (GNI) from that year, we find that the UK contributed 0.64% of its GNI, which is in fact the least of all the member states. This is likely to be because the UK’s VAT and TOR payments are proportionally higher than other countries (see Figure 2). In terms of population, the UK paid €219 per head, which (as illustrated in the left hand plot in Figure 3) means that it ranks 13th out of the 28 member states (the Netherlands paid the most at €498 per head and Bulgaria the least at €64 per head). The per capita revenue can be viewed as a relative measure of the strength of the economies in the EU member states with higher per capita payments being a proxy for stronger economies.
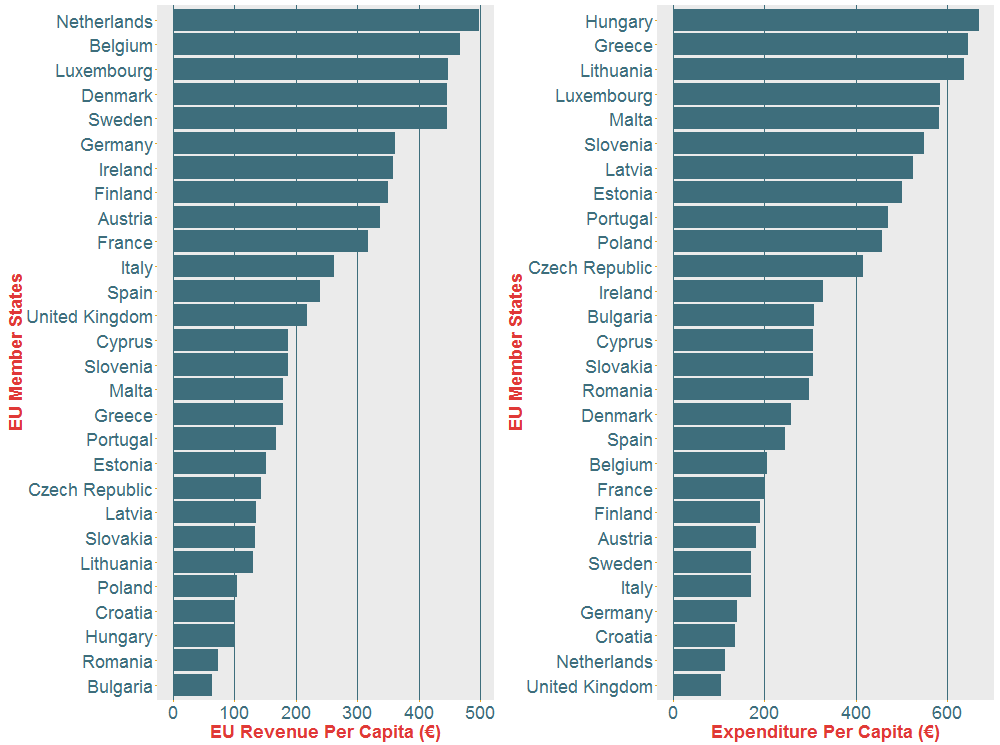
Figure 3: The left plot is a bar chart of each member state’s contribution to the EU budget per capita. The right plot is a bar chart of the amount received by each member state per capita as part of the EU budget’s expenditure. The expenditure plot has been amended to exclude administration payments. Both plots have been ordered from highest to lowest payments.
EU Expenditure
The largest proportion of the EU’s expenditure goes on creating jobs and growth in the EU and on reducing economic gaps between the different member states (44.9%). Sustainable growth accounts for the second largest share (41.6%), which includes spending on agriculture, fisheries, rural development and environmental issues such as climate change. The remaining funds are spent on areas such as security, immigration and the administrative costs of running the EU.
When looking at how the budget is split between the different EU member states, we have excluded administration payments since those countries where the EU is predominantly run (Belgium and Luxembourg) have disproportionally large payments. Since these payments are not used to benefit a member state, we remove them in order to create a fairer comparison.
Looking at the figures relative to the size of the economy or population of each member state can change the picture considerably.
The UK received €6,835 million from the EU budget in 2014 (approximately 50% of the funds it paid in). This is the 7th largest payment across all member states. As with revenue, we can look at this number in the context of both the UK’s economy and population. In terms of its economy, the UK received the 2nd smallest payment from the EU budget as it represented only 0.3% of its GNI (the largest payment in terms of GNI was made to Hungary at 6.6%). We find that the payment equates to €109 per person, which is the smallest amount per capita compared to all other member states (illustrated in Figure 3 above). Overall, in terms of both the UK’s economy and population, it is one of the countries that received the least funds from the EU budget.
What Is the Net Contribution?
To calculate the net contribution of each member state, you would think that you would simply subtract the funds received form the payments made. However, when we did this we found that there were a number of discrepancies in the results, not least of which was the fact that if we summed all of the net contributions we did not get zero! The reason for this is that the EU makes a number of adjustments whilst calculating the overall net contribution (or what the European Commission refers to as the ‘operating budgetary balances’) in order to ensure that each member state is comparable.
Firstly, administration is removed from each member state’s allocated expenditure for the reasons discussed above. Secondly, the TOR payments are not included in the calculation of net contribution since they are considered to be pure EU revenue rather than ‘national contributions’. In addition, the agent who bears the burden of an imposed custom duty is not always a resident of the member state collecting the duty (this relates to goods arriving at ports in, for example, the Netherlands or Denmark, where their final destination is in fact a different member state). For more information on how the European Commission calculates each member state’s net contribution see here.
Using the figures provided by the European Commission, we can plot the net contribution for each member state in Figure 4 below. Those countries to the right of zero are net contributors (i.e. they pay in more than they receive) and those countries to the left are net beneficiaries (i.e. they receive more than they pay in). 10 out of 28 member states contribute more to the budget than they receive, of which the UK is the third largest net contributor. The UK’s net contribution, after adjustments, is approximately €4,900 million. The largest net contributor is Germany (€15,500 million) and the smallest is Poland (-€13,700 million i.e., it is a net beneficiary).
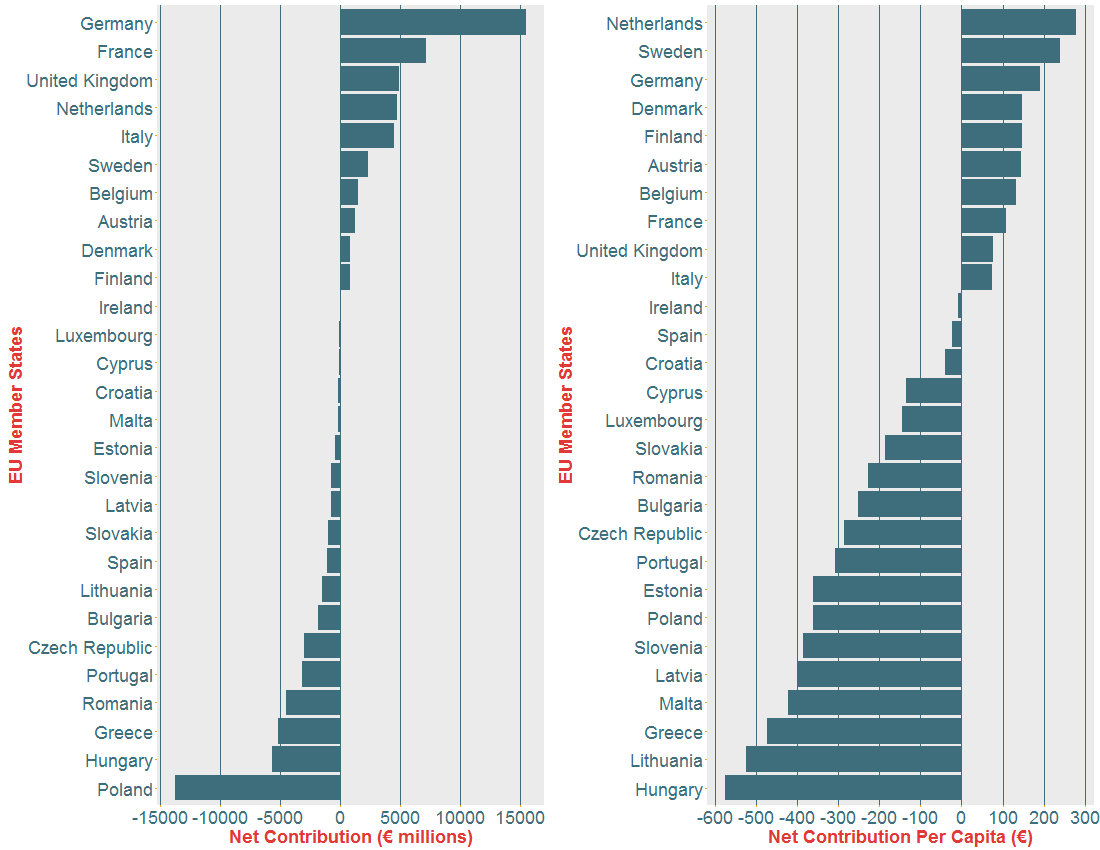
Figure 4: The left plot is a bar chart of each member state’s net contribution to the EU budget. The right plot is also each member state’s net contribution but given per capita. Both plots have been ordered from highest to lowest payments.
These figures can also be broken down by population to obtain the net contribution per capita (see the right plot in Figure 4 above). Doing so doesn’t change which member states are net contributors and which are net beneficiaries, but it does impact the ordering. For example, the UK drops from the 3rd highest net contributor to the 9th highest net contributor per capita, contributing €76 (£59) per head. In overall terms, Germany stands out as paying considerably more than all other member states, whilst Poland looks like it receives much more than any other. However, looking at the figures per capita, we see that the picture changes considerably, with the Netherlands being the highest net contributor per capita and Hungary the highest net beneficiary per capita.
Why Are There Disagreements Over the Figures?
There have been many well-publicised disagreements between the Leave and Remain campaigns as to how much the EU costs us. In particular, those campaigning to leave the EU have stated that Britain could save £350 million a week (as described in this BBC article). This figure was questioned by the UK statistics chief, Sir Andrew Dilnot, who stated that it did not take into account monies rebated by the EU, such as the UK rebate, which we discussed above. You can see his full reply in the letter he wrote to the MP Norman Lamb. Simply taking the figures above, if the UK makes a net contribution of €4,900 million that’s roughly €94 million or £73 million per week which is obviously far smaller than the £350 million headline figure but, arguably, a somewhat fairer and more realistic figure to use.
It is clear that the calculations governing the EU budget are complicated and even calculating the net contribution for each member state is not as simple as one might imagine. However, all of the information required to understand the budget is produced and made freely available by the European Commission. Not only do they provide the top-level budgetary information, but the figures are also split according to the various revenue and expenditure streams and also broken down by member state.
There are lots of other potential costs and benefits of being a member of the EU that are not recorded in its budget.
Of course, the figures above relate only to the flow of cash into and from the EU budget. There are also many less tangible costs and benefits associated with EU membership that are difficult to quantify. We don’t know, for example, how much the UK’s economy benefits directly from EU funding in job growth or research and innovation. On the other hand, being a member of the European single market may benefit trade within the EU, but may negatively impact trade with Commonwealth countries because of the trade restrictions that we might not otherwise have if we weren’t bound by EU rules and regulations. (If you’re interested in finding out more about our trade, we’ll be focussing on this topic in our next blog).
Recently, George Osborne released a Treasury report on the long-term economic impact of leaving the EU. The headline message from this report was that leaving the EU would cost each household an average of £4,300 each year. Using economic modelling, the Treasury has predicted that the UK’s economy would decline if we left the EU resulting in an overall cost for each household. Of course, these figures have been criticised by those in the Leave campaign who state that forecasts of GDP several years in advance are unreliable and that may well be the case. What is clear is that we cannot quantify with certainty what the true financial costs or benefits are of being a member of the EU are nor what the financial implications of leaving the EU would be.