Meta-analysis: Reducing Salmonella in Animal Feed
The Challenge
Salmonella Typhimurium is a pathogen which can cause gastroenteritis in many mammals, including humans. Select were asked by Anitox to combine the results from 90 individual studies which each estimated the mean percentage reduction of Salmonella Typhimurium in animal feed following the application of a pathogen-control product (Berge, 2015).
The studies were conducted for different types of animal feed, and under different conditions including: recontamination or not, different concentrations of pathogen-controlling additive, and different sample sizes, i.e., numbers of culture plates tested. As a result, each study yielded a different effect size for the additive in reducing the presence of Salmonella Typhimurium.
The aim of the project was to collate the results from the individual studies to give overall estimates of the effects of the additive for different feed types and doses, allowing for other differences in the study conditions.
The Solution
When dealing with multiple studies estimating similar effects, a meta-analysis can be used to collate the results, while accounting for how much evidence is provided by each study.
The studies were split into groups based on the type of feed (poultry feed, pet food or protein meal) considered, the additive dosage used, and whether recontamination had occurred or not. This stratification ensured that only those studies designed to estimate similar effects were combined in each case.
However, within each of these groups, examining the treatment effects from the different studies, it was clear that they varied more than we might have expected by chance. In order to account for the heterogeneity in observed treatment effect between the different studies, a random-effects statistical model was fitted to the data, following a similar approach as described in our previous case study: ‘Meta-analysis: Combining Results from Multiple Studies’. This approach allows for there to be real differences in the treatment effect due to, for example, differences in the location, batch of animal feed or study protocol (such as length of time over which the product was applied) used in each study.
As well as producing an estimate of the overall average effect, when performing a meta-analysis, we can also use forest plots as a means of visualising the analysis. These plots provide a way of visually comparing and combining the studies by representing several individual studies, alongside the estimated overall average effect (and the associated confidence intervals), on the same axis. Figure 1 below shows an example of such a forest plot.
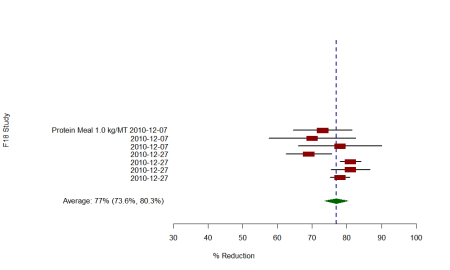
Figure 1. Forest plot showing the average percentage reduction of Salmonella Typhimurium for seven protein meal studies. 95% confidence intervals (black bars) are plotted for each study mean (red rectangle). The black vertical dotted line indicates the overall average effect, estimated via a random effects model meta-analysis, and the green diamond encompasses its 95% confidence interval.
The Value
By using a meta-analysis, we were able to condense the information from 90 studies conducted under different conditions into a set of clear and consistent results for each separate treatment effect of interest. This helped Anitox to better understand the effects of their pathogen-control product, and to optimise treatment conditions and application technology accordingly.
By using a meta-analysis to aggregate the results of different studies, we can draw together many individual, smaller trials, gaining a higher statistical power overall. This means our final estimates are more robust compared to each study individually, and allowing us to make best use of the individual trial results.