Data Visualisation with R’s ggplot2 Package
In data science, analysing your data is only half the battle – communicating your data and results to share knowledge and facilitate decision making is also essential. Data visualisation is a powerful tool that can allow people across all ranges of statistical know-how to understand complex patterns and findings.
The tidyverse is a collection of R packages with data science in mind.
At Select, our go-to analysis tool is the statistical software package R. Not only was R specifically designed for statistical computing, it was also developed with a focus on graphics. As well as the standard plotting functions available in base R, additional functionality is also available through add-on packages of code. The ggplot2 package was developed by Hadley Wickham as part of the tidyverse (a collection of packages designed with data science in mind) and is considered one of the best tools for plotting graphs. It combines high levels of customisation with clean and visually pleasing graphics, often with minimal effort put in on the part of the programmer.
At Select we’ve been putting this to the test, using ggplot2 to develop data visualisations such as those in our EU blog series (for example, see our article ‘How Are EU Migrants Represented Across the UK Workforce?’).
Many large corporations, including Google, Pfizer, Lloyds of London and Shell use R to analyse and present their data. In particular, data journalists on the BBC News’ Visual and Data Journalism team have been using R for complex and reproducible data analysis and to build prototypes for some time. For example, R was used to extract, wrangle, clean and explore data from hundreds of spreadsheets on NHS targets, for their award-winning NHS tracker project.
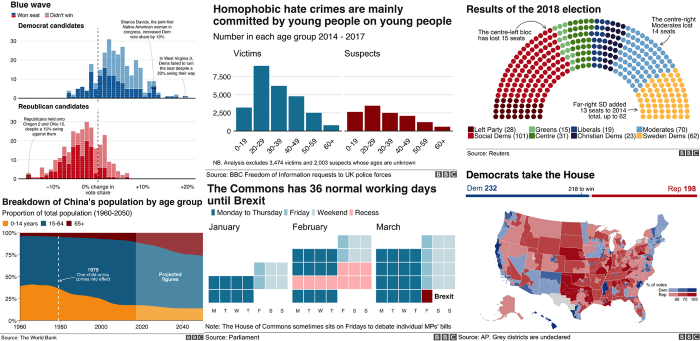
![]() More recently, the BBC have fundamentally changed how they produce graphics for publication on the BBC News website. In their article, ‘How the BBC Visual and Data Journalism team works with graphics in R’, they describe their journey in moving to using R’s ggplot2 package to create production-ready charts. They talk in-depth about how they have documented their progress and code, sharing what they have learned along the way via their BBC R graphics cookbook.
More recently, the BBC have fundamentally changed how they produce graphics for publication on the BBC News website. In their article, ‘How the BBC Visual and Data Journalism team works with graphics in R’, they describe their journey in moving to using R’s ggplot2 package to create production-ready charts. They talk in-depth about how they have documented their progress and code, sharing what they have learned along the way via their BBC R graphics cookbook.
With ggplot2, it is possible to build up style frameworks which can be applied to any future plots, giving all your visualisations a consistent aesthetic theme. The BBC have made theirs public via the bbplot package. At Select we’ve similarly been setting-up a ‘Select theme’ to create clear and consistent plots for all of our projects.
We can also go one step further, creating dynamic web-applications with which viewers can interact using the R package Shiny. This can further enhance the communication of analyses, as discussed in our previous article ‘Interacting with Your Data’. Shiny allows users to interact with statistical codes and outputs; to re-do analyses and explore changing inputs, facilitating scenario planning. You can find lots of other interesting examples of Shiny apps via the Shiny Gallery and User Showcase.
R is a flexible and powerful data processing and analysis tool; combined with the power of its visualisation and web-app tools (including ggplot2 and Shiny), it allows us to help our clients to fully explore and understand their data.