What’s the Chance It Will Rain Tomorrow?
![]() The second joint ExIStA and RSS South West Local Group seminar took place on the 25th of February 2014 with invited speaker Adrian Raftery, Professor of Statistics and Sociology at the University of Washington and University College Dublin. He’s also the World’s most cited mathematician for the decade 1995-2005! Adrian works on the development of new statistical methods for the social, environmental and health sciences, and gave us a fascinating talk focussing on probabilistic weather forecasting.
The second joint ExIStA and RSS South West Local Group seminar took place on the 25th of February 2014 with invited speaker Adrian Raftery, Professor of Statistics and Sociology at the University of Washington and University College Dublin. He’s also the World’s most cited mathematician for the decade 1995-2005! Adrian works on the development of new statistical methods for the social, environmental and health sciences, and gave us a fascinating talk focussing on probabilistic weather forecasting.
Despite most operational weather forecasts being probabilistic and having been so for approximately the last 20 years, most public weather forecasts are deterministic. So rather than being presented with a variety of possible future weather events each with an associated chance of happening, we tend to be given a single prediction of the ‘most likely’ weather that’s expected. A probabilistic forecast would give us much more information, allowing us to see the uncertainty associated with the most likely event and just what chance there is of the possible alternatives. This would help us to make better decisions by explicitly accounting for the uncertainty in weather forecasts.
The most notable exception to deterministic reporting has been the probability of precipitation which has been widely provided with US forecasts since the 1970s. This has not only meant that the American public has been better informed of the likelihood of it raining, but has also helped to expose people to and help them to understand uncertainty.
Adrian has been collaborating with an interdisciplinary team crossing statistics, meteorology and psychology to promote probabilistic public weather forecasts and to determine the best ways of communicating the uncertainty in those forecasts.
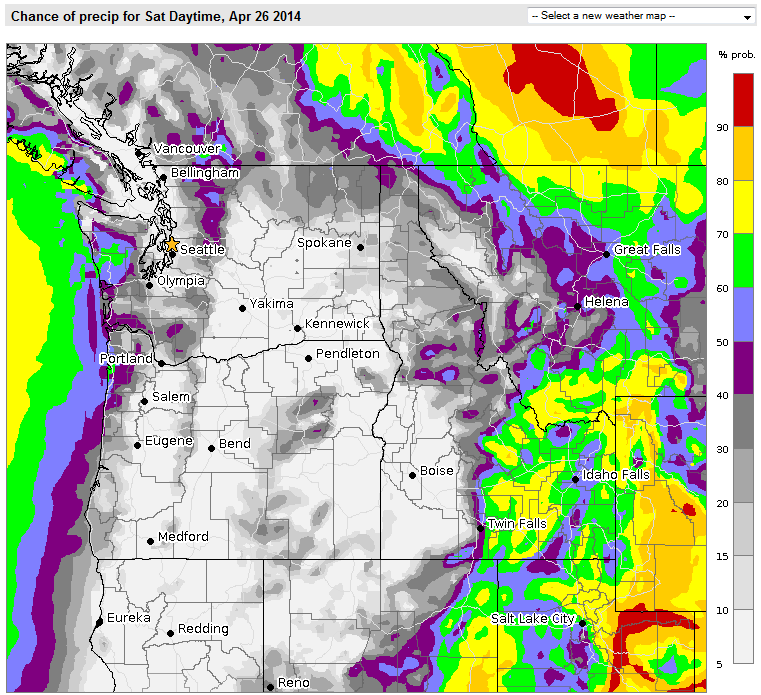
In collaboration with his team, Adrian has been developing Probcast.com a demo website giving illustrative, real time probabilistic forecasts for temperature and precipitation for the Pacific North West. Research conducted with cognitive psychologists has helped to inform the design of the website so that it is as informative as possible to its users. Density plots where 10 or so colours are used to distinguish between, e.g., different chances of rain (as shown in the figure below), have been shown to be more easily interpreted compared with a continuous grey-scale palette, for example.
As well as giving a demonstration of the Probcast website, Adrian also presented some recent advances in probabilistic forecasting using Bayesian Model Averaging applied to wind speed, wind direction and wind vectors. Wind forecasts have been an area of much research as they are crucial to the wind energy industry.
This was a fascinating seminar that gave the audience a glimpse into recent advances in probabilistic weather forecasting and an appreciation for the importance of understanding and communicating uncertainty. If you’d like to find out more about this topic, we’d recommend visiting the University of Washington Probcast Group website. A video of the seminar itself is also available here.