Saving to Prevent Problem Debt
The Challenge
In a previous piece of work, Select helped StepChange Debt Charity by investigating the link between cash savings and problem debt. A key finding from that research was that a lack of cash savings is an important predictor of problem debt, and that savings of £1000 is often enough to safeguard against the problem. In a follow-up project, StepChange asked Select to conduct an analysis to understand which types of households are failing to save, and also to identify attitudinal factors that might influence their decision not to save.
The Approach
To address the questions we analysed data from the Wealth and Assets Survey, a survey of British households conducted by the Office for National Statistics. Using a model known as a classification tree, we partitioned the survey respondents into groups according to a number of socio-economic factors maximising the differences between the groups’ propensity to save. The socio-economic factors we considered included household income, employment status, tenure and the number of dependents. The outcome was 12 groups of households, graded according to the percentage within each group that has at least £1000 cash savings.
To account for any potential biases in the WAS data (from, for example, non-response), we applied survey weights to ensure that the results were representative of the British population. This meant that we could accurately infer from the survey the percentages of households amongst the British population that have at least £1000 cash savings. For example, we found that the subset of the population with the lowest propensity to save is low-to-moderate income renting households, amongst whom around 40% have at least £1000 cash savings. The next lowest subset is very low income households with mortgages and at most one child, amongst whom 60% have at least £1000 cash savings.
To identify attitudinal factors that might influence the decision not to save, we analysed the responses within each of the groups identified above to a number of attitudinal questions in the survey. For each group we determined the distribution of answers to questions such as:
How strongly do you agree or disagree with the statement “I prefer to buy things on credit rather than save up and wait”?
If you had a choice of receiving £1000 today or £1100 next year, which would you choose?
The results showed that groups with a lower propensity to save tend to respond more often in ways that suggest that they do not prioritise the long term financial advantages associated with saving. For example, Figure 1, below, shows a diverging stacked bar chart of responses to the second of the above questions. The groups are ordered from least likely to save (group 1 at the top) to most likely (group 12 at the bottom). The chart shows that as propensity to save increases there is a greater tendency to express a preference for “£1100 next year” rather than “£1000 today”.
The Value
StepChange Debt Charity used our work as the basis for their discussion paper Becoming a Nation of Savers. This paper describes which families in the UK are least likely to have enough saved for a rainy day and calls on government and financial services firms to consider ways in which these families could be helped to overcome economic and behavioural obstacles to saving.
For more information on the work of StepChange Debt Charity, please visit their website.
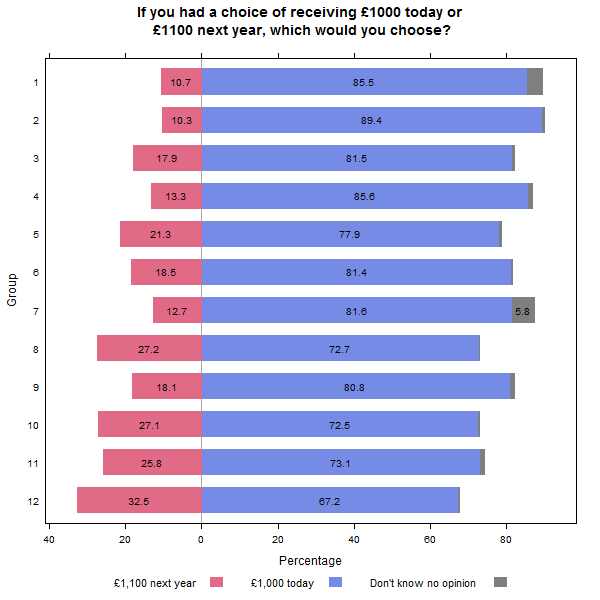
Figure 1: Responses to one of the attitudinal questions, by group. The groups are ordered by propensity to save, with group 1 having the lowest propensity.