Sample Size Calculation for Complex Designs
The Challenge
Experimental controlled trials are an essential part of the development of new production methods or treatments. Calculating the appropriate sample size to demonstrate the efficacy of a new production method or a new treatment is not always straightforward, as the practical aspects of the trial need to be considered.
For example, in an agricultural context, a trial might be set up in a production setting to measure performance indicators of farm animals (such as feed conversion ratio or daily weight gain) in order to compare a new formulation (which we will refer to as the treatment) with a control feed. These types of trials will often be constrained by both animal welfare considerations and ensuring that the trial conditions are as similar to real-life conditions as possible (e.g. minimum and maximum flock or herd sizes, limited numbers of pens within a barn, all-in all-out production systems, etc.).
These logistical constraints mean that it is generally unlikely that a standard experimental design, such as a fully randomised block design, can be used. Therefore, though estimates of the expected effects, and sources and sizes of variation can be obtained from the literature or previous smaller scale studies, there is generally no off-the-shelf sample size calculator or formula that can be applied.
The Solution
Calculating the appropriate sample size for a trial is about getting the right balance between having a sufficient number of subjects to be statistically confident that the minimum desired effect size can be detected and ensuring that the trial is logistically feasible (i.e. it does not need to be run for an extensively long time, or with far too many subjects).
In the absence of a “standard” sample size calculator, we can use a simulation-based approach. This approach consists of simulating a large number of datasets where the number of animals (or individual plants or crops), the number of blocks or other higher-level groupings (such as pens, herds, farms or fields) are varied across a range of values corresponding with likely practical designs.
As with any sample size calculation (or equivalently power analysis), this requires the use of sensible estimates of the expected effect size of the treatment compared to the control group as well as any other important contributors to the trial (e.g., the estimated variability between individual animals, or between groups of animals at the different levels of the design). These estimates can usually be obtained from previous studies, the literature or from expert panels.
The result is a number of simulations that each correspond to a specific sample size. For each simulation, we can fit a statistical model that, combined with repeated runs of the simulation, provides an estimate of the associated power to detect a statistically significant effect of the treatment of interest. The results of the simulations can then be visualised in the form of power curves where the estimated power to detect the desired effect is plotted against the range of sample sizes tested (an example of this is given in Figure 1).
This type of simulation approach gives us added flexibility for it also allows us to test a number of different scenarios. For example, for a range of possible sample sizes, we can investigate how varying the expected size of the treatment effect affects the estimated power to detect a significant effect (demonstrated by the different coloured lines in Figure 1).
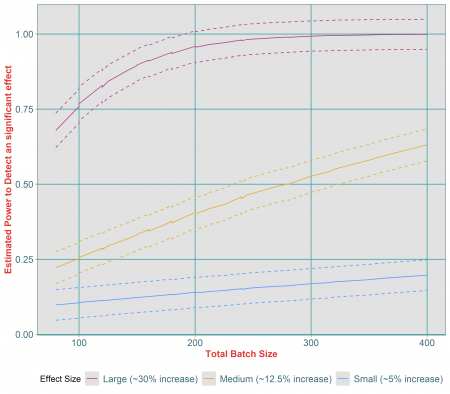
Estimated impact of different effect sizes on the power to detect a statistically significant difference between treatment and control group. The dashed lines around each curves represent the upper and lower confidence intervals around each estimated power.
The results of the simulations in Figure 1 indicate that as the sample size increases, so too does the estimated power to detect an effect. However, the power also varies considerably across the different effect sizes. For example, it is clear that whilst a sample size of 400 individual animals is more than adequate to detect a large effect size if it existed (in fact this effect could be detected with a power of over 80% with a sample size of only 120), this sample size would not be sufficient to detect a small effect size. For a medium effect size, we see that a sample size of 400 individual animals results in a power of 65%, which is equivalent to a 35% chance of failing to detect a statistically significant improvement if one were to exist. Therefore, even for a medium effect, it is likely that a larger sample size would be needed.
Note that this approach could also be carried out on other key variables (not just different possible effect sizes) such as the impact of different amounts of variability between individual subjects (or between groups of subjects) or any other confounding factor that should be controlled for during the analysis of the trial data.
The Value
Whichever final design you choose for your experiment, a simulation-based approach to calculating your sample size ensures that you will have the necessary power to detect a meaningful effect of your treatment with the level of confidence you require, whilst meeting the practical constraints of the trial.
Without having to run a number of different and potentially expensive trials, you can explore a range of scenarios, changing trial conditions or likely treatment effects, to understand their impact and thus inform the final design choice. This further enables you to be confident that your chosen design, including the sample size, will be appropriate to demonstrate and support the aims of your study. While we illustrated the approach in an agricultural experiment context, this type of simulation approach is well suited to any study with a complex design, including nested classifications, such as customer surveys or new stock management processes in the retail or leisure industry, or intervention studies in the education sector.
An additional advantage is that when using a simulation-based approach to calculate the sample size for your experiment, the statistical model that will be used for the data analysis needs to be specified. This also means that once the data has been collected at the end of the trial, the analysis can be done more quickly as the statistical model that will fit the data best has already been developed.