Will it be Turkey this Christmas?
In the UK, we see the turkey as the “traditional” Christmas meat, but this is actually only a recent occurrence. Turkeys were originally a North American import, with the first known turkeys appearing in the UK in 1526. They became fashionable when Edward VII ate them at Christmas, but it was only in the 1950s that turkeys became affordable enough for the majority of the population to enjoy them.
Today, it seems like everyone has turkey at Christmas, but what about the rest of the year? If we look at the data available from the Department for Environment, Food and Rural Affairs for the number of turkeys slaughtered per year, we can see a definite spike around December.
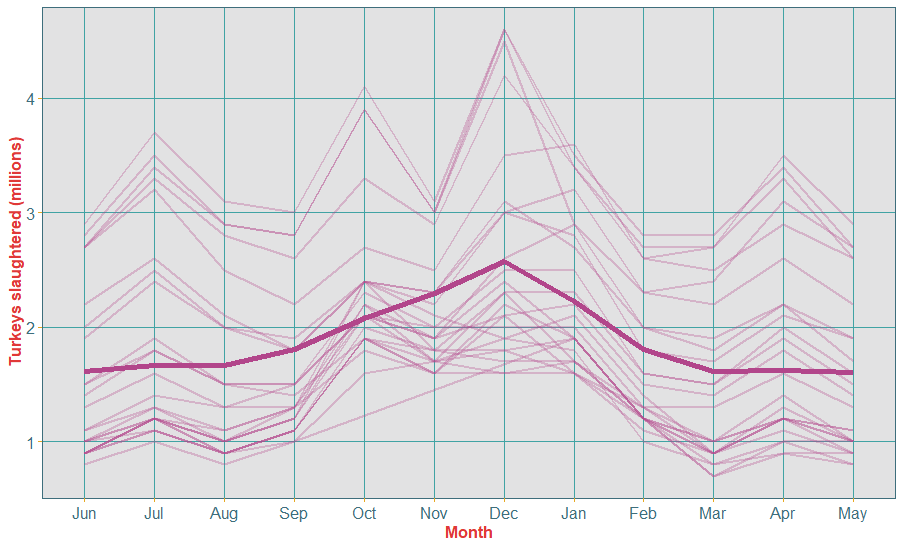
Figure 1: Number of turkeys killed each month between 1994-2017 in the UK: lighter lines showing annual time series with the darker line showing the smoothed trend over time.
From Figure 1 we can see that over the last 20 or so years, nearly 1 million more turkeys are killed around December each year compared to May. The British people tend to enjoy turkey as a seasonal meat – we can see that turkey numbers increase throughout September, October and November before peaking in December. Think about all the Christmas related food sold around this season – Turkey and stuffing sandwiches are not only sold during December!
Since turkeys were originally an American import, how does the UK annual pattern compare to that of the US? Americans have less of a specific tradition around Christmas dinner – “Turkey day” for them refers to Thanksgiving, which takes place on the fourth Thursday of November.
Looking at data available from the United States Department of Agriculture we can see these trends reflected. Figure 2 below shows the UK and US turkey production in pounds, estimated for the UK by using the average turkey weight 14 pounds, and scaled by the population in each country, so that the graph tells us how many pounds of turkey is produced each month per person.
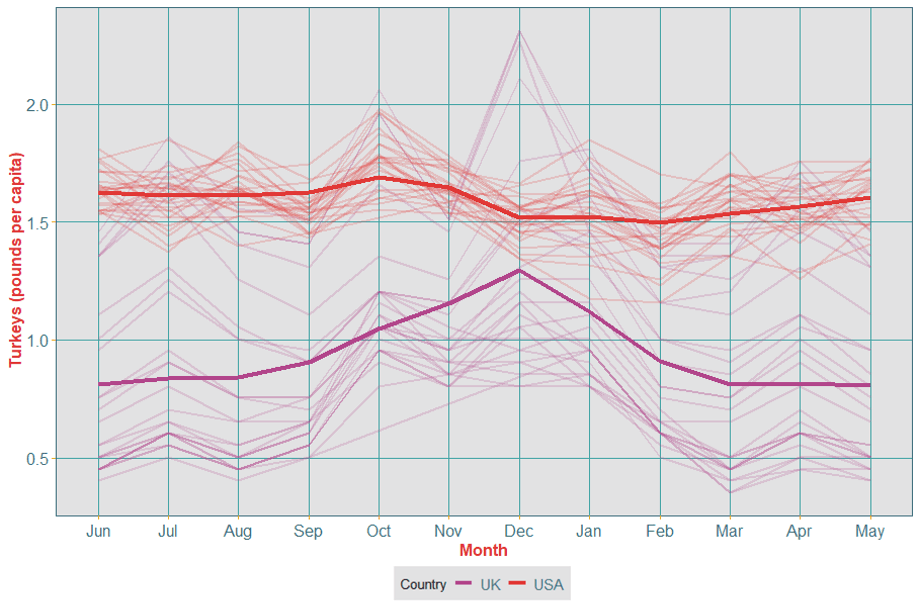
Figure 2: Comparison of turkeys produced in the USA and UK by weight, scaled by their population. Lighter lines show different years with a smoothed average shown as a darker line.
There are two interesting things to note from this plot. Firstly, the smoothed average line shows an increase in the USA’s production of turkeys in October and November, in the lead up to Thanksgiving, compared to the rest of the year. This is interestingly followed by a drop in December; the opposite to what is happening in the UK. Secondly, there is much less variation in turkey production over the whole year compared to the UK, implying that Americans tend to eat turkey at a reasonable steady rate all year long, and not just as a special treat during the holidays.
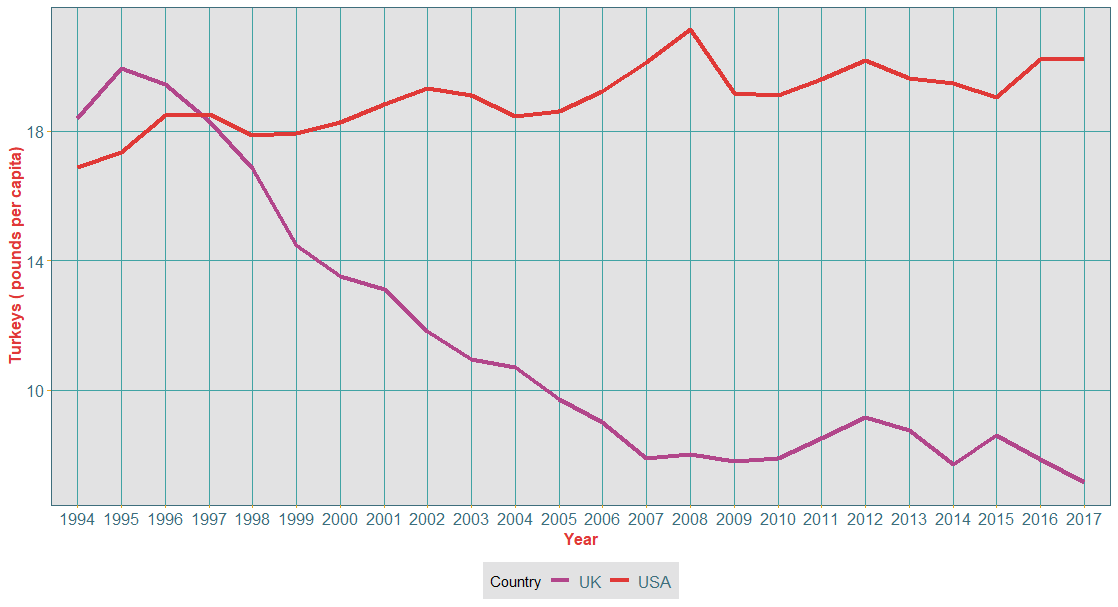
Figure 3: Turkeys slaughtered annually between 1994 and 2017, scaled by population for the UK and USA
We can also look at whether turkey’s consumption has changed by plotting the annual total of turkeys slaughtered in pounds for both countries over the last 24 years (Figure 3 below). It is noticeable from the two previous graphs that there is a lot of variation across years, most particularly so in the UK.
Since the beginning of the century, it appears that UK turkey consumption has been steadily decreasing, and nearly halved between 1995 and 2007, while in the US there has been a slow increase. Could this be due to turkey being replaced by other meats, fish or vegetarian alternatives at Christmas? And you, what are you having for Christmas dinner?