Who Are the UK’s Major Trading Partners?
In our EU blog series, we’re focussing on what we believe to be some of the major issues of debate surrounding the EU referendum. So far we’ve looked into migration (both with the EU and the rest of the World) and at how much being a member of the EU costs the UK. In this blog, we’ve used data from HM Revenue and Customs (HMRC) to explore UK trade (both imports and exports) and better understand who we trade with and what goods we primarily trade in.
Why Is Trade an Important Issue in the EU Referendum Debate?
There has been a lot of discussion and debate surrounding the impact that leaving the EU would have on the UK’s trade both with Europe and worldwide. As a member of the EU, the UK benefits from being a member of the European Single Market allowing the free movement of goods and services. This means that no tariffs are imposed on imports and exports between member states. The EU also has a number of other free trade agreements with countries outside of the EU that facilitate trade between the UK and non-EU countries and which we would lose if we were to leave the EU.
Being a member of the European Single Market allows the free movement of goods and services within the EU.
Those campaigners who would like the UK to remain in the EU argue that leaving would have a negative impact on our economy since we would be charged more in the form of custom duties. This would likely increase the overall prices of products imported into this country from both EU member states and, because of the EU-level trade agreements, non-EU countries. In addition, many believe that we would lose some of the negotiating power for new trade agreements that we currently have as a member state of the EU. This argument was highlighted by Barack Obama’s recent visit to the UK when he stated that the US could take up to 10 years to negotiate trade deals with the UK if it leaves the EU.
On the other side of the debate, those who are campaigning to leave the EU argue that, not only is it beneficial that we will be able to negotiate our own trade deals, but there are examples of countries who are not members of the EU and are still part of the EU’s single market (such as Norway or Switzerland). They argue that we could follow a similar model upon exiting the EU.
As with many of the issues surrounding the EU referendum, we cannot say with certainty what the impact on trade will be if the UK left the EU as it is not clear what trade agreements will remain. However, what we can do is have a better understanding of current trade between both EU member states and the rest of the World.
Who Does the UK Trade With?
HMRC compile monthly data on goods leaving and entering the UK, recording their country of origin/destination, the type of commodity, its value and how it was transported. We’ve downloaded the data for February 2016 (the most recently available data) and plotted the flow of UK imports and exports from and to different regions in the World below using a circular plot known as a chord diagram.
All trade exported by the UK is represented by the light blue flow that leaves the UK segment and splits off to the various other regions. Imports into the UK are represented by the remaining flows that start at the other World regions (each their own colour) and finish at the UK. For example, imports from Asia and Oceania are represented by the green flow and from North America by the orange flow. The relative size of the trade flow between the UK and different regions is quantified by the width of the flow and by the numbers on the radial axis. For example, goods worth approximately £24 billion were exported by the UK in February 2016, of which around £11 billion went to EU countries. Imports were worth approximately £34 billion, which is made up of £18 billion from EU countries (the dark blue flow) and £16 billion from others (the remaining flows).
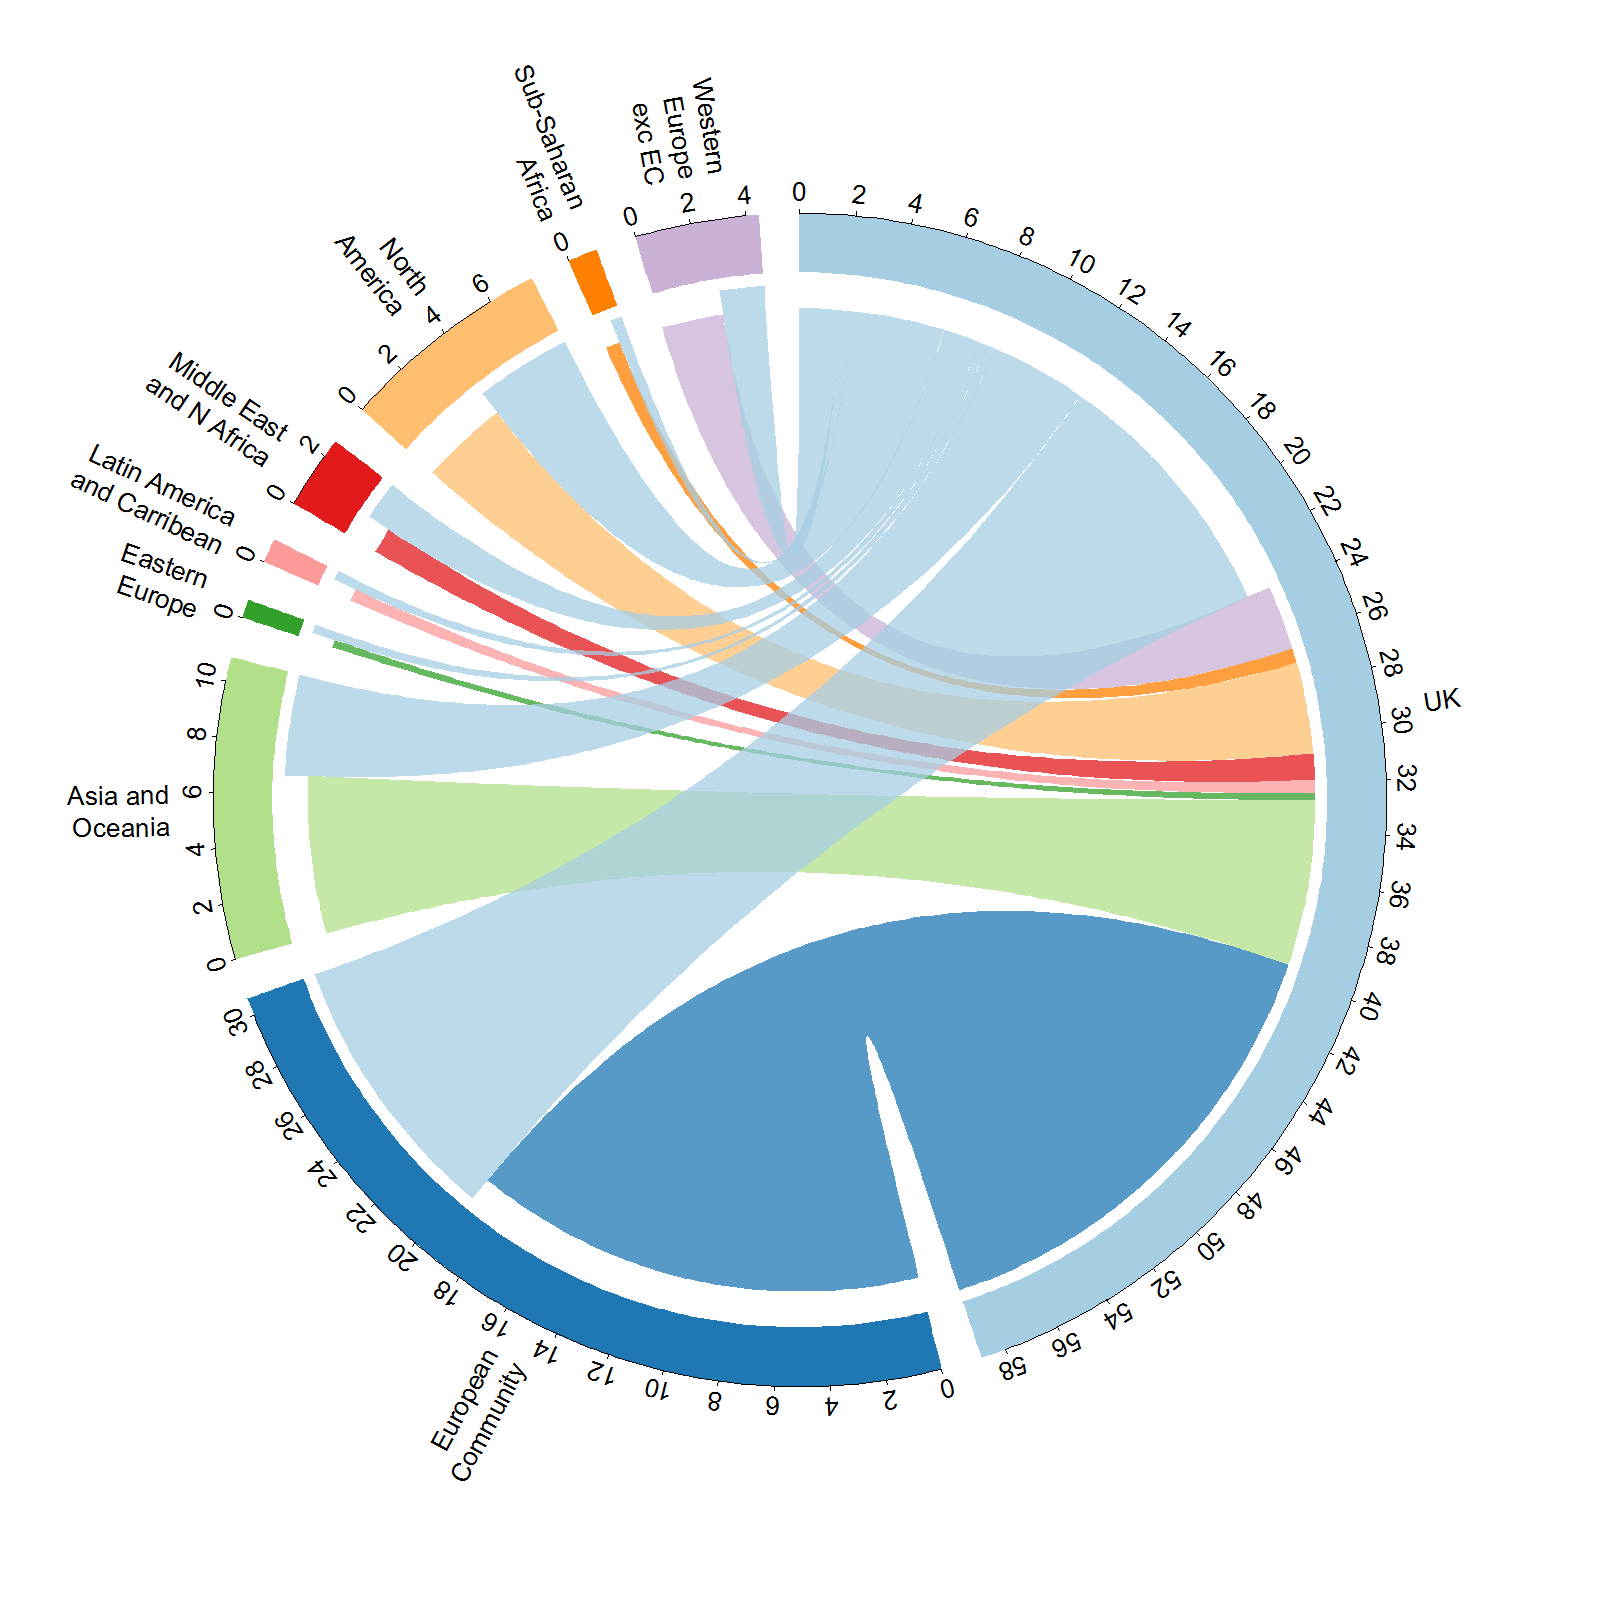
Figure 1: A circular flow diagram of UK exports and imports in February 2016. The axes represent the value in billions of pounds.
The diagram above, illustrates that in February 2016 more UK imports and exports took place within the EU than any of the other regions in the World. The second largest exchange of goods took place with countries within Asia and Oceania, followed by North America and Western Europe (excluding EU member states). We can also see that the UK imported more goods (£35.2 billion) than it exported (£24.1 billion). The UK was a net importer in February 2016, with imports exceeding exports by £11.1 billion. Based on information on the HMRC website, the UK has consistently been a net importer for a number of years.
The bar chart below compares UK imports and exports between EU and non-EU countries in February 2016. It highlights that the UK exported more goods to non-EU countries than EU countries (53.5% of all UK exports go to non-EU countries), but more imports came from EU countries (55.1% of all imports into the UK were from an EU member state). For both sets of countries (EU and non-EU) the UK was a net importer of goods. Although these numbers specifically relate to February 2016, the HMRC have plotted the proportion of EU trade in terms of export and import over time here, demonstrating that this pattern (the UK imports more from EU countries, but exports more to non-EU countries) is consistent over time.
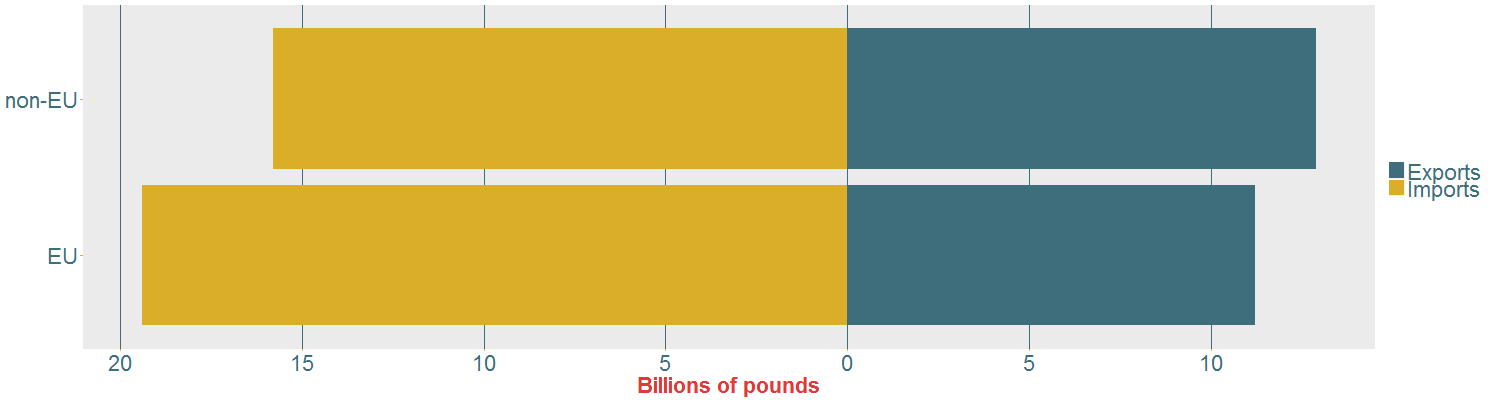
Figure 2: Bar chart illustrating the total amount of exports and imports exchanged between the UK and both EU and non-EU countries.
So far we have only looked at UK trade on a regional basis. To understand whether there are particular countries that are critical to UK trade, we have plotted a bar chart of the top 20 importers and exporters to the UK in Figure 3 below.
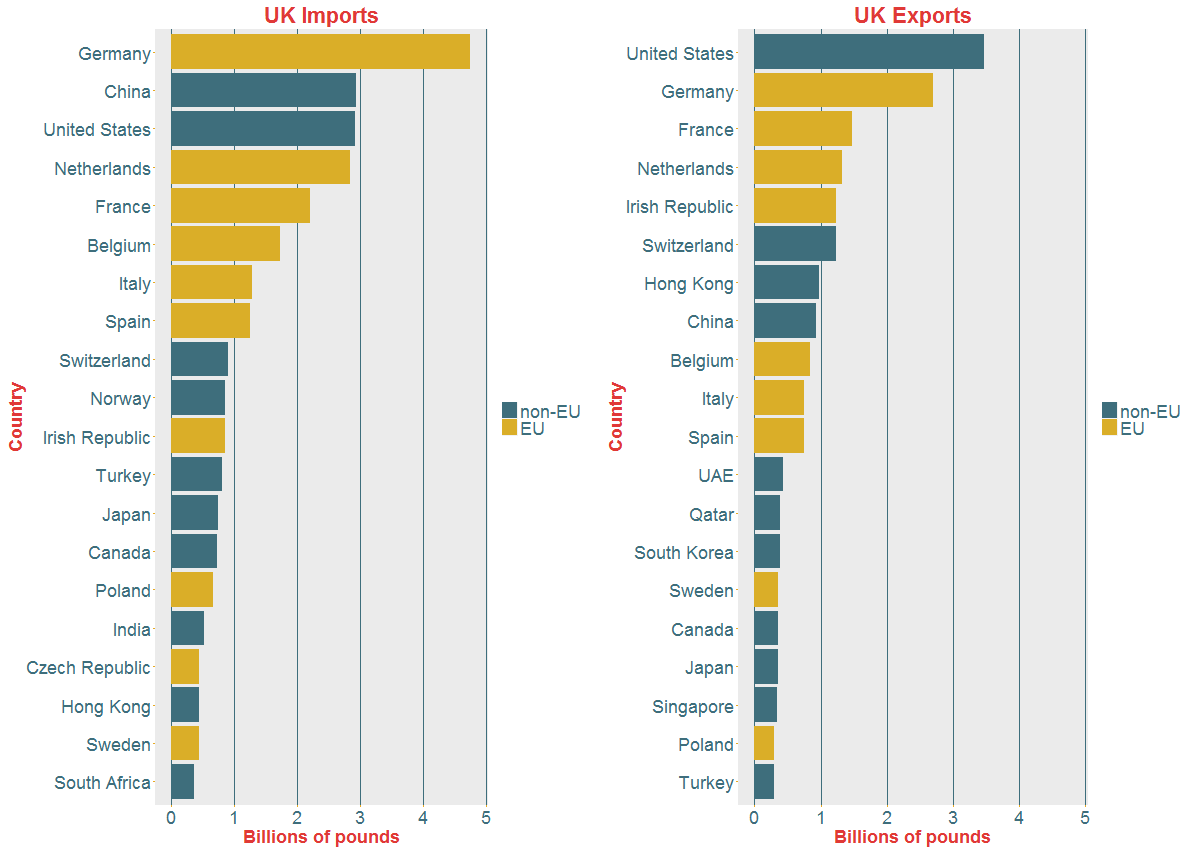
Figure 3: Bar charts illustrating the top 20 importers to the UK (left plot) and exporters from the UK (right plot) in February 2016. The amount is given in billions of pounds and countries which are EU and non-EU have been highlighted using different colours.
Germany was the largest importer into the UK in February 2016 (£4.75 billion) followed by China (£2.94 billion) and the US (£2.93 billion). In terms of exports, the UK exported the most goods to the US (£3.47 billion), followed by Germany (£2.70 billion) and France (£1.48 billion). In both plots, it is clear that there is a roughly equal split between EU and non-EU countries and, in particular, 3 out of the top 5 importers and 4 out of the top 5 exporters are countries from the EU.
What Are the Key Commodities That the UK Trades In?
Using Government commodity codes, goods traded in and out of the UK are classified into groups such as motor vehicles, pharmaceutical products or precious metals. In Figures 4 and 5, we have plotted the top 10 commodities in terms of value that were imported and exported to and from the UK in February 2016, split by whether they were traded with EU or non-EU countries.
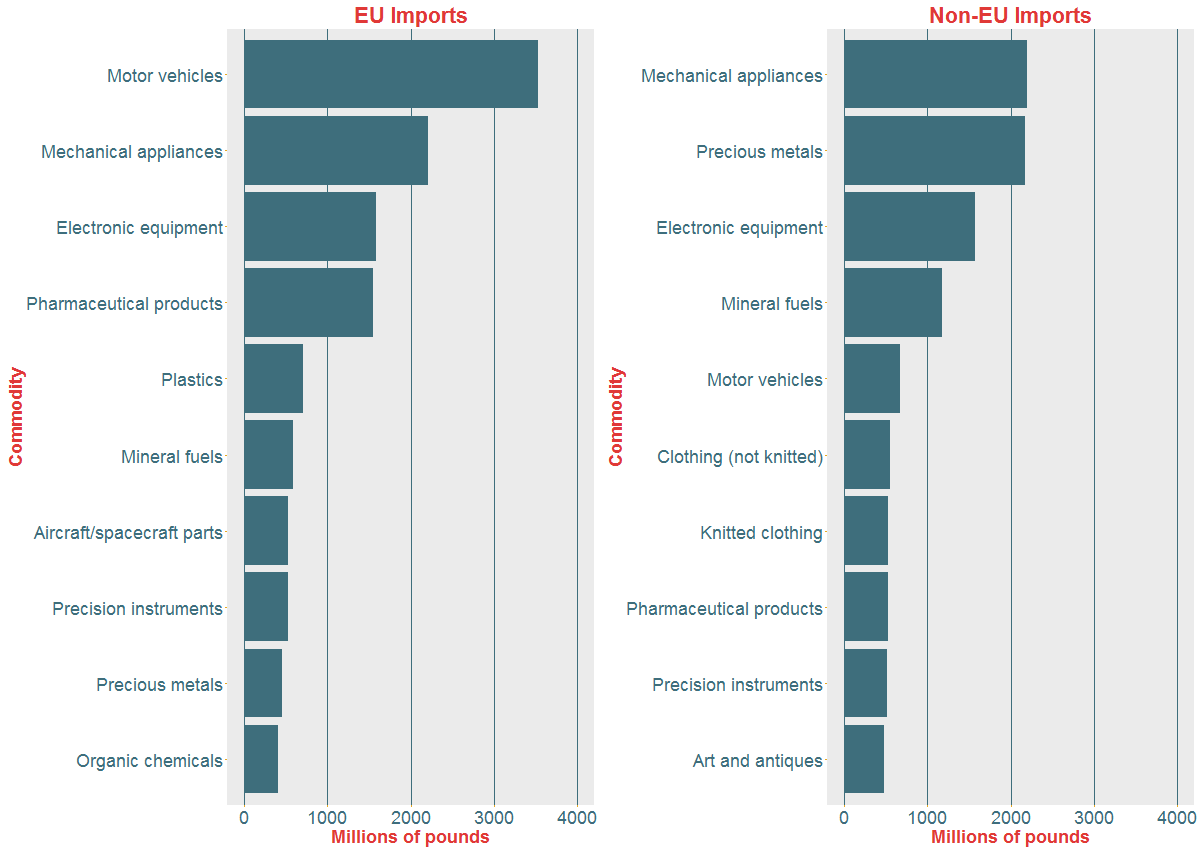
Figure 4: Bar charts illustrating the top 20 commodities (in terms of value) imported into the UK in February 2016 split by those imported from EU countries (left plot) and from non-EU countries (right plot).
Although many of the commodities imported are common to both EU and non-EU countries, there are differences in terms of the total values. For example, motor vehicles are the highest value commodity to be imported from EU countries (£3,526 million), whereas they are the 5th highest from non-EU countries (£673 million). Clothing appears twice in the top 10 imports from non-EU countries (£547 and £523 million for non-knitted and knitted clothing, respectively), but not at all from EU countries. Approximately the same value of electronic equipment and mechanical appliances were imported from both EU and non-EU countries (approximately £1600 million and £2200 million respectively).
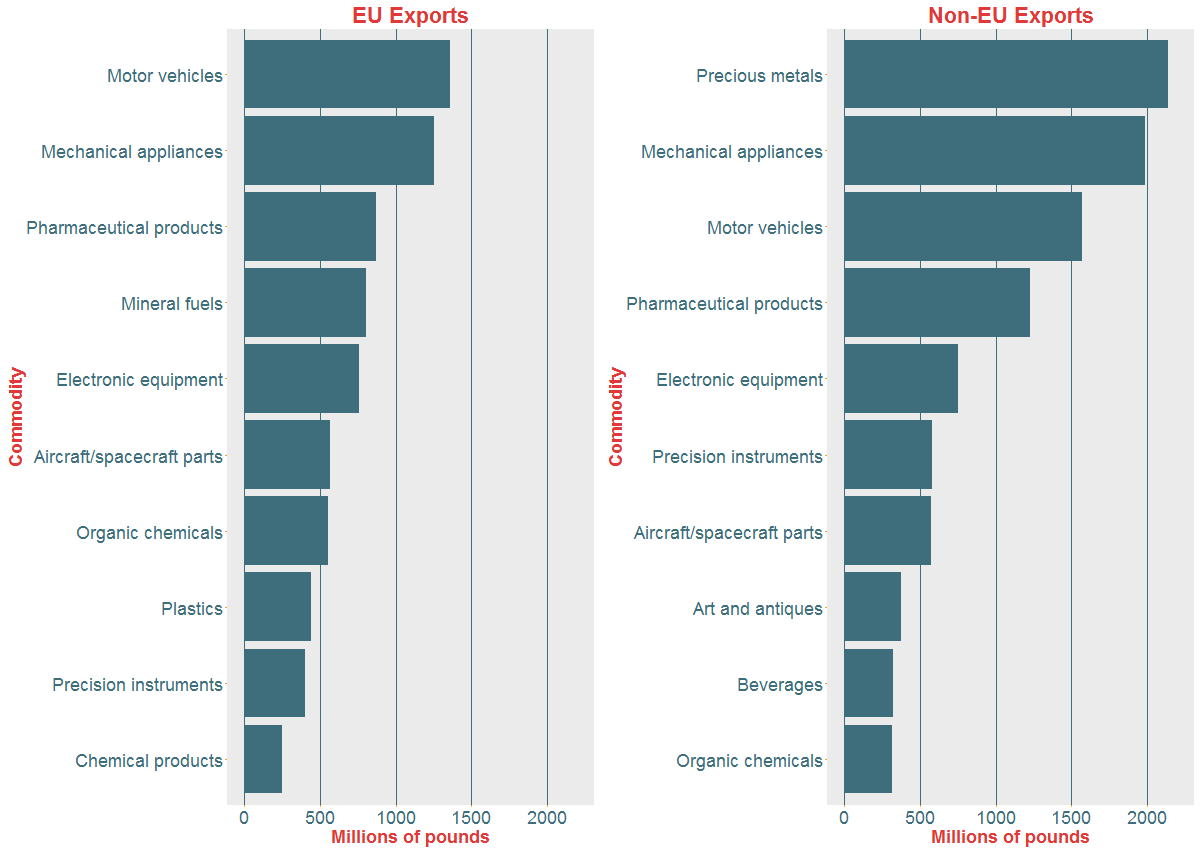
Figure 5: Bar charts illustrating the top 20 commodities (in terms of value) exported from the UK in February 2016 split by those exported to EU countries (left plot) and to non-EU countries (right plot).
As we saw in Figure 2, looking at exports in February 2016, we find that the UK exported more to non-EU countries than EU countries. There are many similar top 10 commodities such as motor vehicles, mechanical appliances and pharmaceutical products. Notable differences include precious metals, which is the UK’s top export to non-EU countries (£2,138 million), but is not in the top 10 for EU countries. Other categories included in the non-EU countries include art and antiques (£374 million) and Beverages (£320 million). The top 10 exported commodities to EU countries include mineral fuels (£806 million), plastics (£439 million) and chemical products (£252 million).
What Does the Government Say about Trade with the EU?
Interestingly, the Government used trade statistics as one of their key arguments for remaining in the EU in the leaflet that they sent to every household in the UK. They stated that:
“The EU is by far the UK’s biggest trading partner. EU countries buy 44% of everything we sell abroad, from cars to insurance. Remaining inside the EU guarantees our full access to its Single Market. By contrast, leaving creates uncertainty and risk.”
In the statistics for February 2016, we found that the UK exported 46.5% of all goods to EU countries, which is close to the 44% stated in the quote above. The two numbers don’t exactly tally, since not only is our figure a snapshot of one month, the Government’s figure includes the trade of both goods and services and the HMRC data is only of goods.
Are the trade statistics impacted by the Rotterdam effect?
One of those MPs campaigning to leave the EU, Bernard Jenkin, wrote to the UK Statistics Authority chairman Sir Andrew Dilnot regarding this statistic to ask whether it inflated the present trading position with the EU since it included exports to the rest of the World which leave the UK via ports in other EU states (known as the “Rotterdam effect”). This is an interesting point and, in fact referring back to Figure 3, we can see that the Netherlands is the 4th highest country both for imports and exports in February 2016. Is it possible that many of the exports that are classified as going to the Netherlands are in fact subsequently being be shipped to other countries in the World?
Andrew Dilnot replied stating that whilst the Rotterdam Effect is difficult to quantify, previous work by the ONS indicated that it could affect up to 50% of goods exported to the Netherlands, which would be around 2% of the UK’s total exports of goods and services. Overall, ‘this suggests that the statement in the government leaflet is not significantly affected by it’. This doesn’t seem a large affect, given that the Netherlands is highlighted as being a large customer of UK exports (Figure 3), however this is because the Rotterdam Effect only affects exports of goods, whilst the figure given by the Government includes goods and services.
Summary
Using data from HMRC, we have looked into who the UK trades with and what its biggest trading commodities are. Comparing the UK’s trade (in terms of both imports and exports) with other regions of the World, it is clear that the EU contributes a large share. In February 2016, 46.5% of all UK exports went to EU countries and 55.1% of all imports came from EU countries. These proportions are relatively consistent over the past few years. Key countries that the UK trades with are the US, Germany, China, France and the Netherlands.
The commodities that the UK trades in are often common across both EU and non-EU countries such as motor vehicles, mechanical appliances, electronic equipment and pharmaceutical products. There are notable exceptions, for example, more precious metals are exported to non-EU countries than those within the EU and we import more clothing from non-EU countries. Thus, different sectors within the UK economy are likely to be affected in different ways and to different extents.
Given the complexity of UK trade with the rest of the World and the large part that the EU plays, both as a trading partner and in terms of the trade agreements it has in place with other countries, it is clear that when choosing how to vote in the referendum, we must consider the impact that leaving the EU will have on the UK’s trade. The key questions being will we remain in the single market and how will the trade agreements that are currently in place with non-EU countries be affected if we were to leave?