Measuring Human Behaviours and Traits with Item Response Theory
In the fields of education and psychology a frequent ambition is measurement. Unlike physical qualities, like height or weight, which are usually measured with a ruler or a scale, the measurement of characteristics of people is achieved using a different instrument; a test or assessment. Educational assessments aim to measure students’ aptitude or ability in, say, mathematics or non-verbal reasoning. Psychometric assessments seek to measure other behavioural or human characteristics, for example, quality of life, self confidence or political persuasion. These qualities are known as latent traits because they are intrinsic and not directly measurable.
Item response theory (IRT) is a statistical modelling technique used in the field of measurement. IRT assumes that there is a single underlying trait, which is latent and that this latent trait influences how people respond to questions. As IRT is often used in education the latent trait is often referred to as ability. Item response theory models the probability of a person correctly answering a test question (an item), given their ability. After running an IRT model we can obtain estimates for each person’s ability, and also for each item’s difficulty (some items are easier or harder than others). We would expect someone with a lower ability measure to get the easier items correct but get fewer or none of the more difficult items correct. And we would expect someone with higher ability to get more of the difficult items correct. While we tend to still talk in terms of ability and item difficulty, IRT can be used to measure other character traits, not just academic ability, with items or questions that measure these.
As such, item response theory can be used to analyse surveys since a commonly used survey question format is the Likert scale, where respondents are asked how much they agree to a series of statements, with response options ranging from ‘strongly disagree’ to ‘strongly agree’.
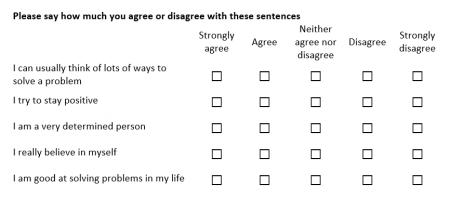
An example are the statements below, which were asked of Year 8 to Year 10 pupils in the NHS’s National Study of Health and Wellbeing Survey of children and young people in 2010.
Questions of this kind ask respondents about a number of components that are closely related and which assess different aspects of a single underlying trait, in this case resilience. People with high levels of resilience will tend to agree and strongly agree with these statements, while people with low levels of resilience will tend to disagree.
Using IRT we can measure respondents’ resilience and also their propensity to endorse statements like those above.
Most Likely Responses
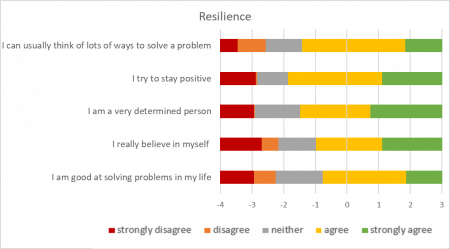
IRT puts the thresholds (the boundaries between “strongly agree” and “agree”, and between “agree” and “neither”, etc) for all of the statements onto the same scale, i.e., in terms of the respondents’ levels of resilience in this example. The figure below shows the thresholds for the 5 statements above. The coloured bands show at what point on the scale each response (from “strong disagree” to “strongly agree”) is most likely, depending on someone’s level of resilience. You can see that these don’t all occur in the same place; that the point at which ‘agree’ is more likely than ‘neither’ for “I try to stay positive” is lower down the scale than for “I am good at solving problems in my life“.
While a chart like the diverging stacked bar chart is useful for comparing levels of agreement and disagreement (as demonstrated in this previous blog: Analysing Categorical Survey Data), it positions neutrality in the same place and symmetrically for all statements. By positioning the statements on the same scale, i.e. in terms of resilience in this case, we can compare how easy each statement is to endorse. Of the five statements, pupils who responded to this survey found “I am a very determined person” one of the easiest statements to endorse. The threshold between agree and strongly agree is 0.7. Whereas the equivalent threshold for the statement “I am good at solving problems in my life” is 1.9. This second statement is more difficult to endorse; pupils need a higher degree of resilience (scores higher than 1.9) before “strongly agree” becomes the most likely response.
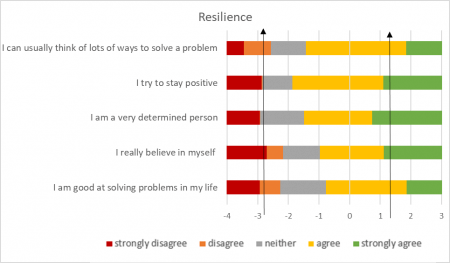
To illustrate this further, take two example pupils; one with a resilience score of -2.8, the other with a resilience score of 1.3. These are marked on the diagram below with arrows.
Each pupil’s most likely response is indicated by the region in which their arrow lies. The pupil with the lower resilience score of -2.8 is most likely to “disagree” with the first and last statements, “I can usually think of lots of ways to solve a problem” and “I am good a solving problems in my life“; they are most likely to answer “neither” to “I try to stay positive” and “I am a very determined person“; and they are most likely to “strongly disagree” with the fourth statement, “I really believe in myself“.
The pupil with the higher resilience score is most likely to “agree” with the first and last statements, “I can usually think of lots of ways to solve a problem” and “I am good a solving problems in my life“; and most likely to “strongly agree” with the other three statements.
Why use IRT?
While using pupils’ IRT scores to understand their most likely responses to the statements is a useful exercise, it is mostly illustrative (it can be useful for reporting, for example). IRT is itself a statistical model (also known as a confirmatory factor analysis) and provided this model fits the response data well, the resulting IRT scores provide robust, continuous measures that can be used in further analyses.
IRT scores could be used to compare latent traits like ability or resilience between, say, groups of pupils. This would allow comparisons to be made between those who have received an intervention and those who haven’t, to assess its effectiveness. These scores could also be used in further statistical modelling to, for example, explore relationships between these attributes and other characteristics or outcomes.
