Is There a North/South Divide in GCSE Performance?
Each year the Department for Education (DfE) publishes GCSE results for schools in England in the form of Performance Tables making it possible to compare the performance of pupils in individual schools or in groups of schools (e.g. Local Authorities or Multi-Academy Trusts) to performance nationally.
In a previous blog we looked at the GCSE results of pupils in different regions of England and examined the current and historical differences in attainment between the North and the South.
Updated analysis of the 2017 results by School Dash shows that the pattern of attainment (pupils in the South tending to perform better than pupils in the North) is still present in the latest GCSE results published by the DfE.
Mapping the percentage of pupils achieving 5 or more A* to C grades at GCSE (including grade 4 or higher in English and Maths) in 2017 for each Local Authority (LA; see Figure 1) shows the same pattern of attainment as with the 2015 GCSE results in our previous blog; that higher performing local authorities tend to be those located in the South (although as discussed in our previous blog there are clearly regional differences).
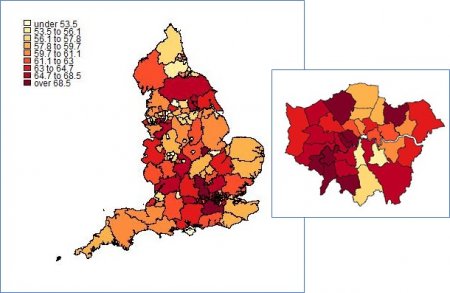
Figure 1: The percentage of pupils achieving 5+ A*-C GCSEs 2017 by LA
Fitting a statistical model to this data showed that, on average, 63% of pupils in the South gained 5+ A*-C grades compared to 59% of pupils in the North; this result was statistically significant.
What are the drivers of LA GCSE performance?
Comparing GSCE results by region is very simplistic. It is likely that factors other than region affect the educational attainment of pupils. The DfE and other government departments publish a wealth of data about schools and regions, so we combined the GCSE results at LA-level with data about their pupils’ characteristics, teacher vacancies, and deprivation measures (averaged across each LA).
To include these variables in the analysis, we fit a statistical model to the GCSE results at LA-level and add them as explanatory variables to the model (we also included North/South as an explanatory variable). The factors that were significantly associated with GCSE performance are shown in the chart below. In this model there ceased to be any real difference between pupils from the North and the South; any differences being accounted for by differences in background factors.
For each of these factors, figure 2 below shows how the percentage of pupils achieving 5 or more good grades at GCSE deviates from the national average (61%). Also shown, for comparison, is the difference for pupils in the North compared to the South. Not only has the gap in performance between pupils in the North and South decreased (now less than 1 percentage point compared to the previous 4 percentage point difference), this difference is not statistically significant.
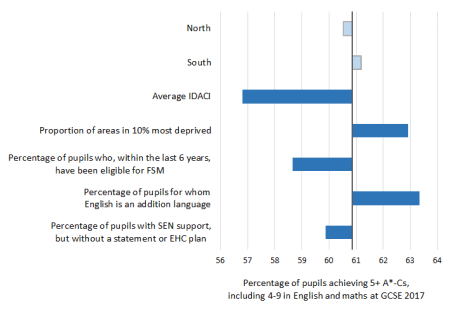
Figure 2: Standardised model coefficients for the variables associated with GCSE performance
Figure 2 shows us that the variables that are statistically significant include those that represent:
- deprivation measures, namely the average IDACI (income deprivation affecting children index) and the proportion of the LA that is in the 10% most deprived areas in the country;
- pupils’ characteristics, namely the percentage of pupils eligible for free school meals (FSM), with English as an additional language (EAL) and special education need (SEN) support.
Clearly deprivation measures are associated with GCSE performance though their interpretation is complicated. GCSE performance tends to be lower in areas that are generally more deprived (measured by average IDACI), but this is offset somewhat in LAs with larger areas in the top 10% most deprived areas of the country. LAs with higher proportions of pupils eligible for FSM (also a measure of deprivation) tend to have lower GCSE performance.
LAs with higher proportions of pupils with EAL tend to have higher GCSE performance, while LAS with higher proportions of pupils with SEN support tend to have lower levels of GCSE performance. Once these factors have been taken into account there is no longer any real difference between the GCSE performance of LAs in the North and South of England.
This can be further illustrated by looking at the model residuals; these are the differences in GCSE performance that remain after taking account of differences that are due to levels of deprivation, and proportion of pupils with FSM, EAL and SEN. Figure 3 shows the model residuals for LAs in England. The figure illustrates that the regional differences dissipate; that LAs where performance is above average (indicated in shades of yellow to red) and LAs where performance is below average (indicated in shades of blue) are distributed across the country; there is no geographic pattern, confirming that the differences in performance are not driven by a North/South divide.
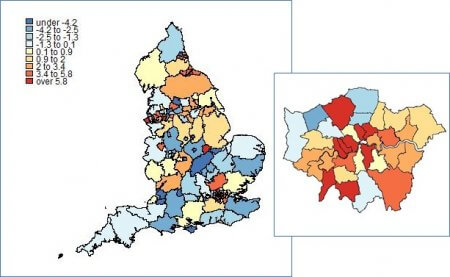
Figure 3: Model residuals for England and for London.
The connection between deprivation and performance
The model results highlight that deprivation is clearly an important factor associated with school performance. Mapping deprivation (in this case the average IDACI measure) for LAs illustrates the similarity to the pattern of GCSE performance.
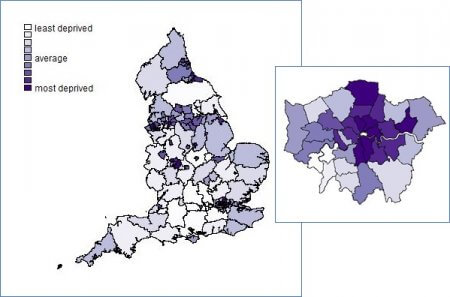
Figure 4: Deprivation (average IDACI) for England and for London
Areas with higher GCSE performance in Figure 1 (shaded red) tend also to be the areas with lower deprivation in Figure 4 (paler shades), and areas with lower GCSE performance (e.g. cities such as Hull, Leicester, Derby, Nottingham, Stoke) have relatively high levels of deprivation (shaded darker purple). While there are areas in the North that are less deprived, e.g. North Yorkshire and the East Riding of Yorkshire, there are clusters of more deprived areas in other parts of Yorkshire, around the river Mersey, around Birmingham and in the North East.
It is noticeable that the ‘city effect’ seen in the previous blog, is still observed here; that the higher levels of deprivation and lower GCSE performance observed in a number of other cities is not reflected in LAs in central London. London has similar levels of deprivation as some of the areas in the North (the North East, the North West, Yorkshire and the West Midlands) and yet, while taking deprivation into account, the percentage of pupils gaining 5+ A*-Cs in LAs in London is between 5 and 7 percentage points higher than other regions of the country.
The link between education outcomes and disadvantage is not a new discovery and has been explored and discussed by others previously. Why London seems to do relatively well is not established and there are many other examples of schools and pupils that overcome their disadvantages and do well, demonstrating that the link between education outcomes and deprivation can be broken. A report by the Northern Powerhouse Partnership (Educating the North: driving ambition across the Powerhouse) published in February this year highlights “the devastating consequences of disadvantage in the North” and calls for “the government, local authorities, businesses and others to invest in our children and young people, to ensure they have the future they deserve.”
Why modelling is important
The factors associated with GCSE performance are multifaceted and complex. Even in this simple example we have shown that to really begin to understand why there are variations in GCSE performance it is important to use a statistical model. Once other variables are included in the model the North/South divide disappears. However, this model is limited and could be improved. More of the differences in regional performance (more of the variation) could be explained by adding more variables; we have not included any information about pupils’ home background, for example. If data were available, as well as background factors, further refinement could be added by drilling down to the school level, or lower. While statistical models can usually be improved they are often a balance between detail and parsimony.