Do School Performance Tables Really Measure School Performance?
According to the Northern Powerhouse Partnership, the latest research shows that “league tables punish and reward the wrong schools”. Last month they published the results of a study which showed that the standard measures of schools’ performance at GCSE produce different rankings when pupils’ background characteristics are taken into account, indicating that the performance table results may over- or under-estimate results for schools with pupils from certain backgrounds.
Until fairly recently, the government measured secondary schools’ performance using an unadjusted measure – the percentage of pupils who achieve 5 or more A* to C grades at GCSE. Now, one of the secondary school accountability measures is Progress 8, which takes account of prior attainment. Progress 8 measures how pupils’ GCSE attainment in 8 designated subjects compares to pupils who have the same level of prior attainment when they started secondary school (at the end of Key Stage 2). Since the Progress 8 measure takes account of prior attainment it is a value-added measure and purports to measure the additional value added by each school over and above their pupils’ starting point.
“league tables punish and reward the wrong schools”
However the study, conducted by researchers at the School of Education at the University of Bristol, demonstrates that the relative position of schools’ results change when you not only take account of pupils’ starting points, but also take account of the differential performance of pupils’ from different backgrounds, including measures of deprivation. Some schools see large increases or decreases in their relative position. Characteristics such as the levels of SEN and deprivation of a school’s intake, or of successive cohorts, are factors that schools have no influence over. The authors make the point that it is not sufficient to only take account of pupils’ prior attainment, that in addition to their starting point, other aspects of pupils’ lives can also influence their progress, and this should be recognised when judging schools. They say that the Progress 8 measure doesn’t recognise the extent of educational disadvantage that some schools are facing and unfairly reflects aspects of pupils’ backgrounds rather than recognising the outstanding job that some schools are doing in challenging contexts.
We have created these two plots (below) which show schools in rank order according to their results. The one on the left shows schools in order of their Progress 8 results, the one on the right shows the order after taking pupils’ background characteristics into account. The red lines show the average ranking across schools in each of the 9 regions of England.
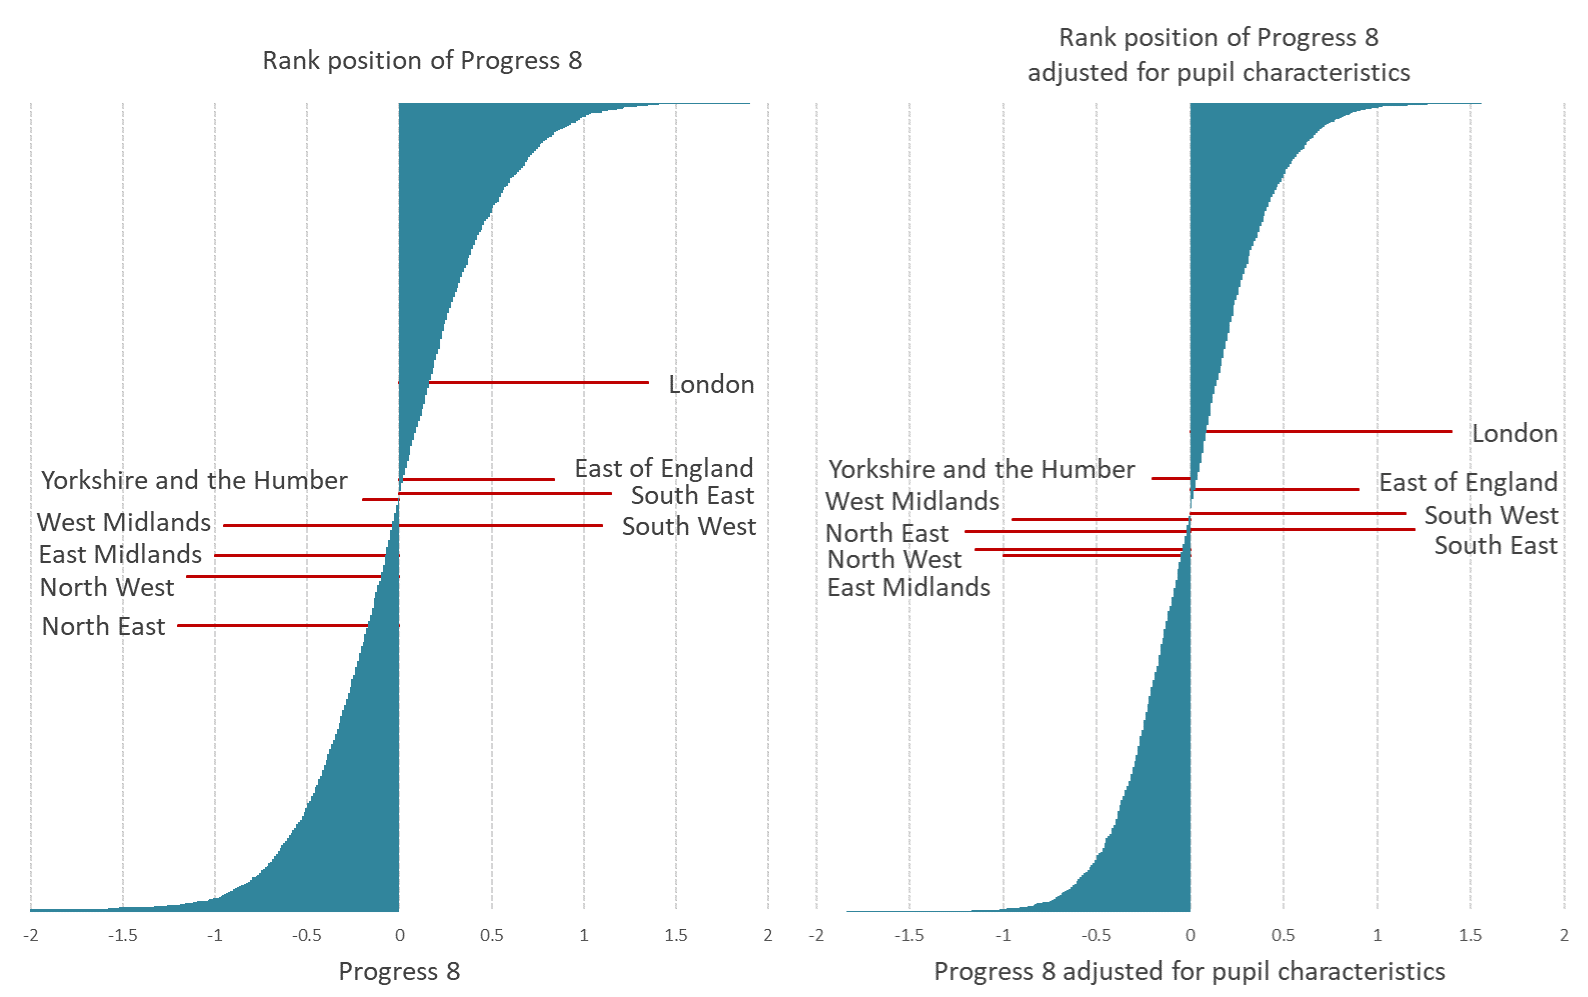
Note that the uncertainty in these estimates (i.e. confidence intervals) are not shown.
On the left we see that schools in London, on average, rank the highest, with an average value of 1073 (out of a total of 3091 schools). Schools in the North East have the lowest average ranking, followed by schools in the North West. On the right, after taking background characteristics into account, we see that the order changes. Schools in London still have the highest ranking on average but their position has dropped 184 places in the rank order. The North East and North West have increased their relative positions, with the average rank of schools in the North East and in the North West increasing by 361 and 107 respectively.
This mirrors the results of our previous blog, which showed that apparent differences in GCSE performance between schools in the North and South of England can be explained by differences in levels of deprivation.
The debate about how best to measure school performance, about whether to use raw results, value-added or contextualised value-added models (those including school and pupil background factors) is not new in the field of education. Different models will give different results, but they address different questions.
It might be surprising how much results change depending on the factors included in the model. By including pupil background characteristics in their model the authors believe they are closer to isolating the effect of the school by removing the effects of confounding factors. It is important, not just with school results, but with all statistical models, to think carefully about what makes up a model. By considering what variables are included, and also what is not included, we can understand what conclusions we can and cannot draw from the model results.