Classifying Binary Outcomes
In a recent post in our blog series on analysing categorical data, we discuss how a logistic regression can be used to model a binary response. A variable that is binary has only two outcomes such as male/female or yes/no. When we apply a logistic regression, it allows us to estimate the probability of the binary outcome based on the values of the explanatory variables.
“We need to be able to classify our predictions into one of two binary outcomes”
Like all statistical models, a logistic regression can be used for two primary purposes. The first is to understand the relative importance and effects of the different explanatory variables or drivers (as described in the student grad school admissions example in our previous blog post). Its other primary function is to forecast or predict an outcome for any particular set of driver values. In this case, the logistic model will provide the probability of a particular outcome occurring. For example, in the case of the student admissions example, we may be interested in finding out the probability of a student obtaining a place on a post-graduate course given the marks from their undergraduate degree and the institution they attended.
In some cases a probability on its own is not sufficient and we need to make an explicit decision (e.g., admit/not admit). An interesting real World example of this is a recent analysis that we carried out for Mid Essex NHS Trust on the results of a study on extubating intensive care patients. During the study the outcome of extubations were recorded together with a number of explanatory variables such as the patient’s ability to cough or the volume of secretions in the patient’s airways and lungs (for more details of this work see our case study). Applying a logistic regression meant that we were able to predict the chance of a successful extubation for new patients, given the observations available for that patient. Since the NHS Trust wanted to be able to use the model as a medical decision tool, the probability alone was not sufficient; they needed a cut-off probability beyond which a clinician should be encouraged to extubate.
Using a ROC Curve
The cut-off probability or threshold at which extubation is advised, should be chosen so that the number of times it results in a successful extubation far outweighs the number of times it is unsuccessful. This logic is typically used in a medical context since it is often better to extubate later than necessary rather than to run the risk of the complications arising from extubating too early.
We can ensure that our threshold is optimised to this logic by choosing a threshold that maximises the true positive rate (TPR) of the statistical model whilst minimising the false positive rate (FPR). The former is the proportion of successful extubations that are correctly classified as such, whilst the FPR is the proportion of failed extubations that were incorrectly predicted to be a success. TPR is also referred to as the sensitivity and 1-FPR the specificity of the model.
A Receiving Operating Characteristic (ROC) curve is a useful tool that allows us to examine the trade-off between these two metrics by plotting the TPR against the FPR for a variety of different classification thresholds. As an example, the ROC curve for the logistic regression in the extubation study is provided in Figure 1. Each point on the line in Figure 1 represents a different threshold for classification, ranging from all probabilities classified as failures in the bottom left-hand corner (i.e., 0% TPR and FPR) and all probabilities classified as successes in the top right-hand corner (i.e., 100% TPR and FPR).
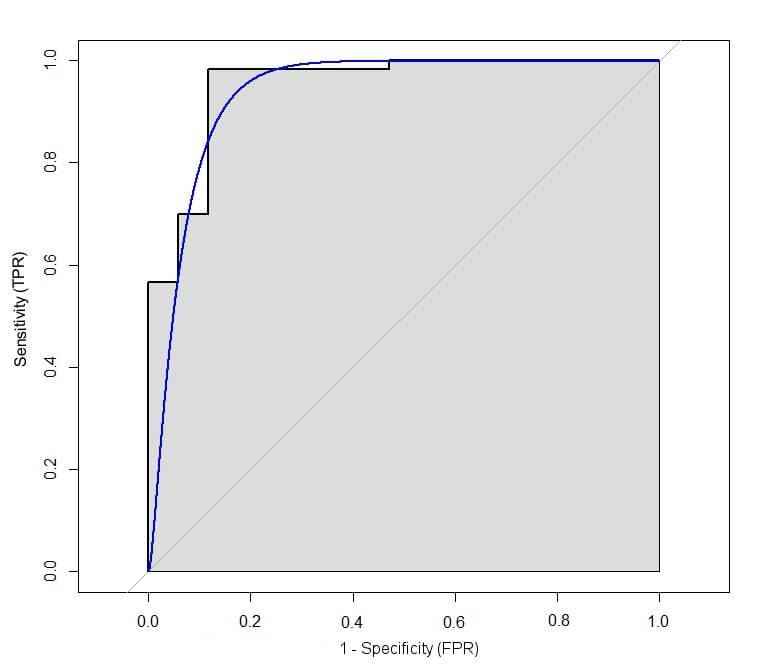
Figure 1: Example of a ROC curve from Mid Essex NHS Trust extubation study.
The best possible predictive model would be one with a 100% TPR and 0% FPR, which corresponds with the top left-hand corner of the figure for the ROC curve above. Consequently, an ‘optimal’ threshold is often chosen by identifying the threshold corresponding the point on this curve that is closest to this corner. Whilst this measure is often chosen in a medical setting, it is not the only one available; for example you could consider a metric that weights the TPR and FPR, if you are concerned with minimising or maximising one more than the other. We’ll be considering these alternatives in one of our next blogs.
In the Mid Essex NHS Trust extubation study, the TPR and FPR were given equal weight and the ‘optimal threshold’ was found to be 0.39. Thus, the decision would be to extubate whenever the predicted probability of a positive outcome was greater than 39.4%. This would then optimise the expected proportion of correct diagnoses amongst those for which the decision to extubate was made.
How Good Is the Model?
The ROC curve is also a useful indicator of how well the model is able to perform classification. If the ROC curve follows the diagonal y=x line (the light grey line in Figure 1) then any classifications are no better than predicting at random, e.g., by tossing a coin. Ideally we want the curve to lie above the line as this indicates that the classification is better than if we were to classify the outcome randomly. We can formalise this by calculating the Area Under the Curve (AUC), which is illustrated by the area that is shaded grey in Figure 1. The AUC represents the accuracy of the predictive model where 1 is the best possible value, 0.5 is equivalent to predicting at random and a value of less than 0.5 is even worse. In the case of the extubation model, the AUC was found to be 0.96. This value is based upon a sample of data and, like all estimates, is subject to a sampling error. To account for this and express our uncertainty about the estimate we calculate a 95% confidence interval which in this case is between 0.91 and 0.99. Given that the AUC of a perfect model would be 1, this illustrates that the extubation model has strong predictive capacity for extubation outcome and may be useful when predicting extubation failure.
Logistic regression models are useful tools for predicting the probability of a binary outcome. However, there are instances when we need to take this a step further and classify the outcome based on a cut-off probability threshold. In this blog we’ve illustrated how a ROC curve can be used to help examine the trade-off between false positive and true positive rates and identify an optimal threshold for binary classification. Furthermore, the area under the curve of the ROC also provides us with a descriptive statistic that summarises the overall predictive accuracy of the model and to assess whether or not the model is actually performing well.