Assessing Questionnaire Reliability
Questionnaire surveys are a useful tool used to gather information from respondents in a wide variety of contexts; self-reported outcomes in healthcare, customer insight/satisfaction, product preferences in market research. We invariably use surveys because we want to measure something, for example, how frequently people exercise, voting intentions, the percentage of your customers that would recommend you to a friend. As such, surveys can be viewed as a measurement instrument. In the same way that thermometers measure temperature and pH meters measure acidity, surveys can measure behaviours, attitudes and opinions.
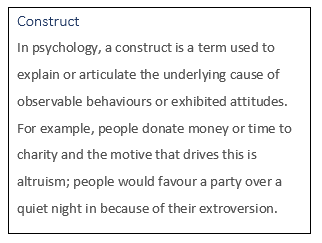 While some things we want to measure are simple and can be asked in a single question, for example “How do you intend to vote?” or “Do you plan to go to university?“, we may actually wish to consider a broader perspective, for example political views or future aspirations. Maybe what we are interested to measure cannot be summarised in a single question, measuring a healthy lifestyle or wellbeing, for example. Surveys are often employed to measure more complex and multifaceted human behaviours or characteristics, known as constructs. Being complex and multifaceted these are better measured by asking a series of related questions covering different aspects of the construct of interest. The responses to these individual questions can then be combined to form a score or scale measure along a continuum.
Reliability and Validity
Two important qualities of surveys, as with all measurement instruments, are consistency and accuracy. These are assessed by considering the survey’s reliability and validity.
There are a number of different statistics we can use to estimate reliability and to make an assessment of validity. Choices of which statistics to consider will depend on the survey design and purpose. Some statistics may be more suitable in certain situations, and different statistics will give different results, reflecting different aspects of the survey’s performance. Reliability and validity are also not fixed qualities, they may change over time. Consequently it is desirable to use a number of alternative statistics to get a rounded assessment of a survey’s qualities.
In this blog, we focus on approaches to assessing reliability. We will discuss how to assess a survey’s validity in a future blog.
Reliability
Reliability is the extent to which an instrument would give the same results if the measurement were to be taken again under the same conditions: its consistency.
How do we assess reliability?
One estimate of reliability is test-retest reliability. This involves administering the survey with a group of respondents and repeating the survey with the same group at a later point in time. We then compare the responses at the two timepoints.
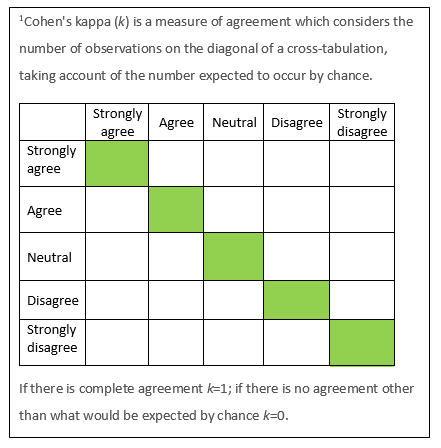 For categorical variables we can cross-tabulate and determine the percentage of agreement between the test and retest results, or calculate Cohen’s kappa1.
For continuous variables, or where individual questions are combined to construct a score on a scale, we can compare the values at the two timepoints with a correlation.
One immediately obvious drawback of test-retest reliability is memory effects. The test and the retest are not happening under the same conditions. If people respond to the survey questions the second time in the same way they remember responding the first time, this will give an artificially good impression of reliability. Increasing the time between test and retest (to reduce the memory effects) introduces the prospect of genuine changes over time.
If the survey is to be used to make judgements or observations of another subject, for example clinicians assessing patients with pain or mental health issues, or teachers rating different aspects of children’s writing, we can compare different raters’ responses for the same subject; inter-rater reliability. Here we would use the same statistics as for test-retest reliability. As with test-retest reliability the two measurements are again not taken under the same conditions, the raters are different; one may be systematically “harsher” than the other.
Parallel-form reliability involves developing two equivalent, parallel forms of the survey; form A and form B say, both measuring the same underlying construct, but with different questions in each. Respondents are asked to complete both surveys; some taking form A followed by form B, others taking form B first then form A. As the questions differ in each survey, the questions within each are combined to form separate scales. Based on the assumption that the parallel forms are indeed interchangeable, the correlation of the scale scores across the two forms is an estimate of their reliability. The disadvantage of this is that it is expensive; potentially double the cost of developing one survey.
An alternative is split-half reliability. Here we divide the survey arbitrarily into two halves (odd and even question numbers, for example), and calculate the correlation of the scores on the scales from the two halves. Reliability is also a function of the number of questions in the scale, and we have effectively halved the number of questions. So we adjust the calculated correlation to estimate the reliability of a scale that is twice the length, using the Spearman Brown formula.
Split-half reliability is an estimate of reliability known as internal consistency; it measures the extent to which the questions in the survey all measure the same underlying construct. Cronbach’s alpha is another measure of internal consistency reliability. For surveys or assessments with an even number of questions Cronbach’s alpha is the equivalent of the average reliability across all possible combinations of split-halves. Most analysis software will also routinely calculate, for each question or questionnaire item in the scale, the value of Cronbach’s alpha if that questionnaire item was deleted. These values can be examined to judge whether the reliability of the scale can be improved by removing any of the questionnaire items as demonstrated in the example below.
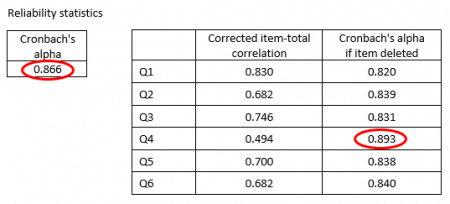
The scale that is constructed from these 6 questionnaire items has a Cronbach’s alpha of 0.866. The 4th questionnaire item (Q4) has the weakest correlation with the other items, and removing this questionnaire item from the scale would improve the reliability, increasing Cronbach’s alpha to 0.893.
In this blog we have discussed various approaches to assessing reliability. Reliability and validity are interconnected. If a survey has poor reliability it will have poor validity. However, good reliability does not necessarily mean a survey will have good validity. Soon we’ll post another blog considering validity.